Create an analysis report
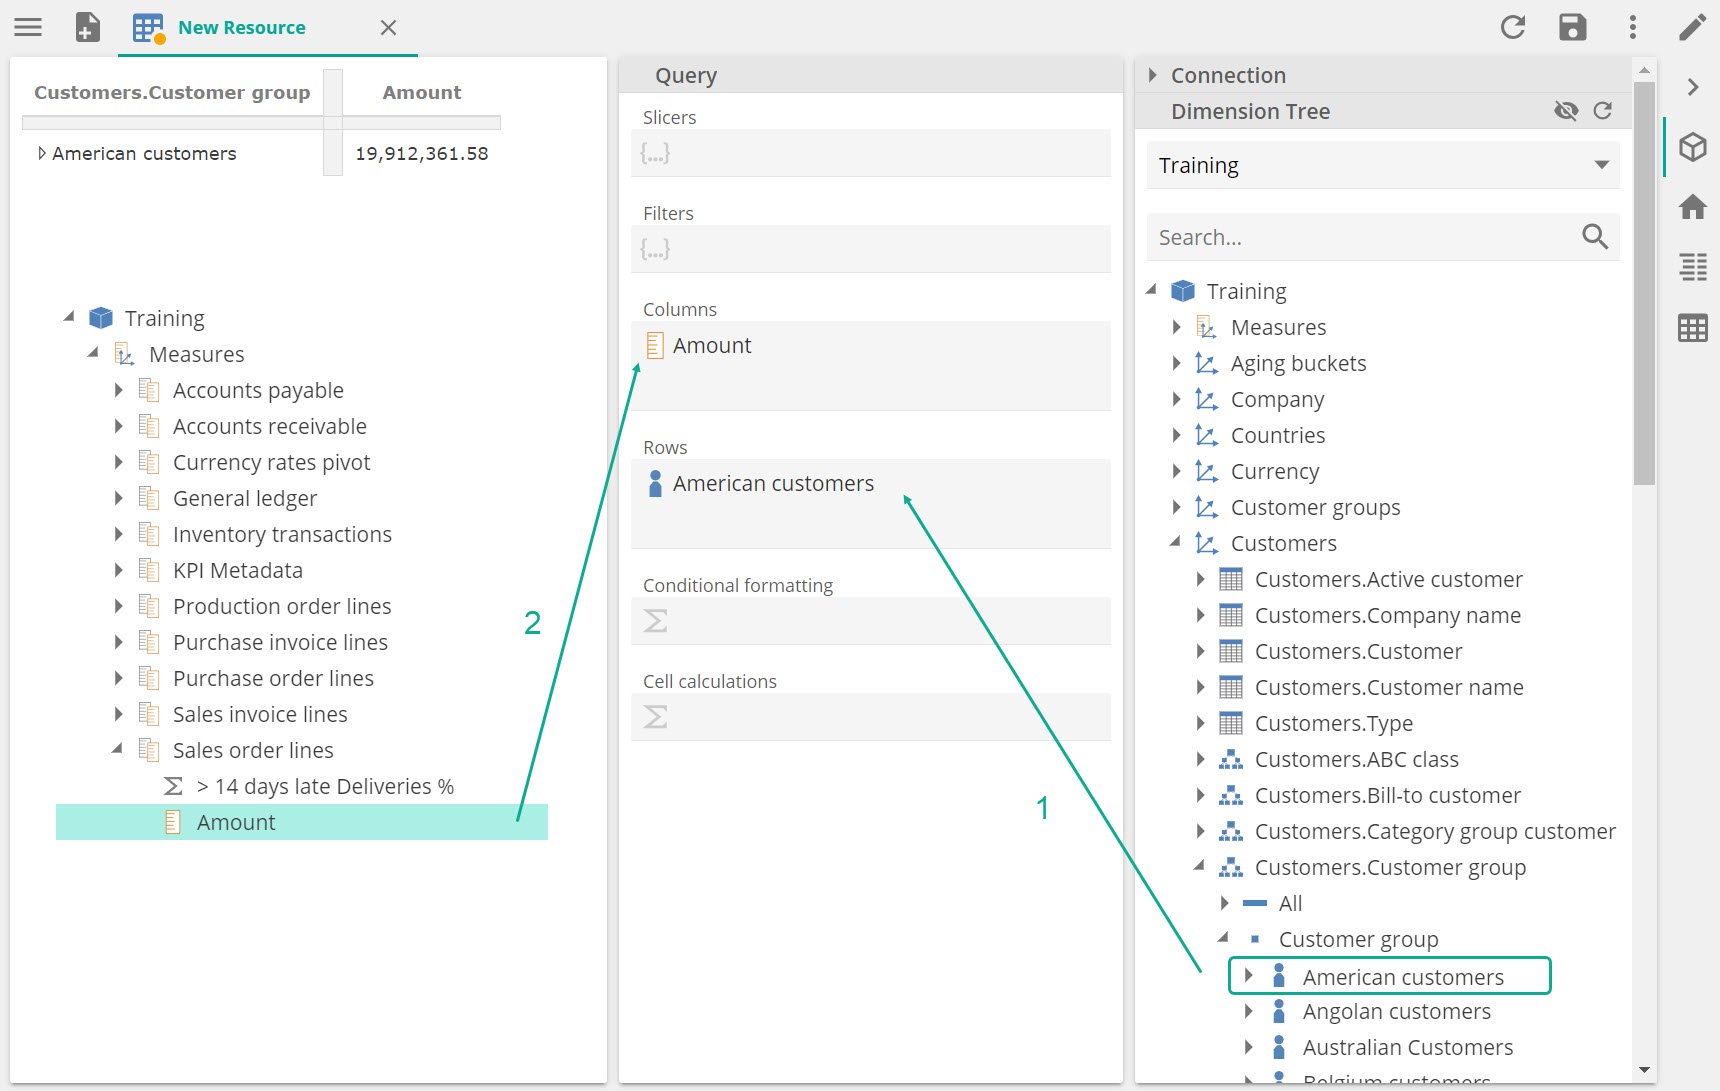 |
Number in Image | Description |
1 | Drag a measure into the Columns placeholder (Amount) |
2 | Drag a member into the Rows placeholder (American Customers) |
Click New resource > Analysis Report.
Drag elements from the Dimension Tree or existing resources such as charts, functions, or named sets from the Resource Explorer to the Rows or Columns placeholders in the Query window
Optional Functions:
Filter
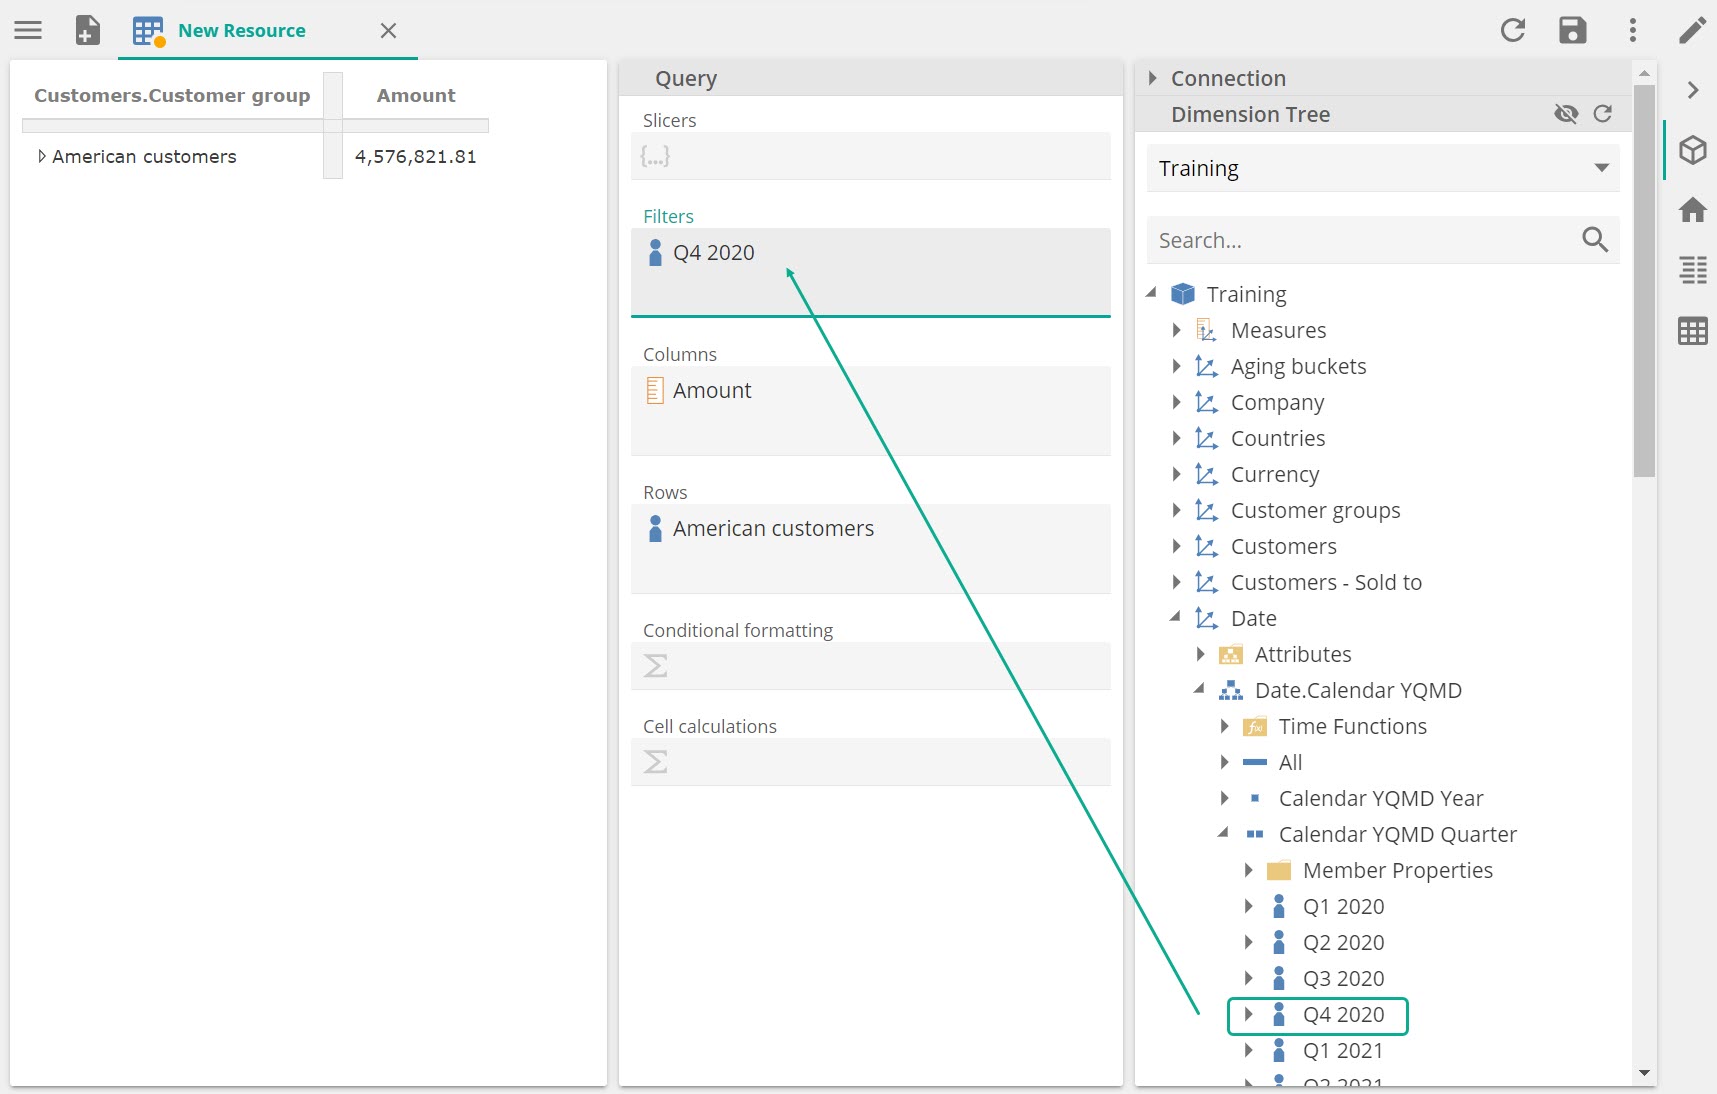
Filter the data set using the Filters placeholder. Hover to create a custom formula, named set, or function, drag a hierarchy or level into the section.
Click the section to apply further filters such as dynamic user-defined parameters.
Slicer
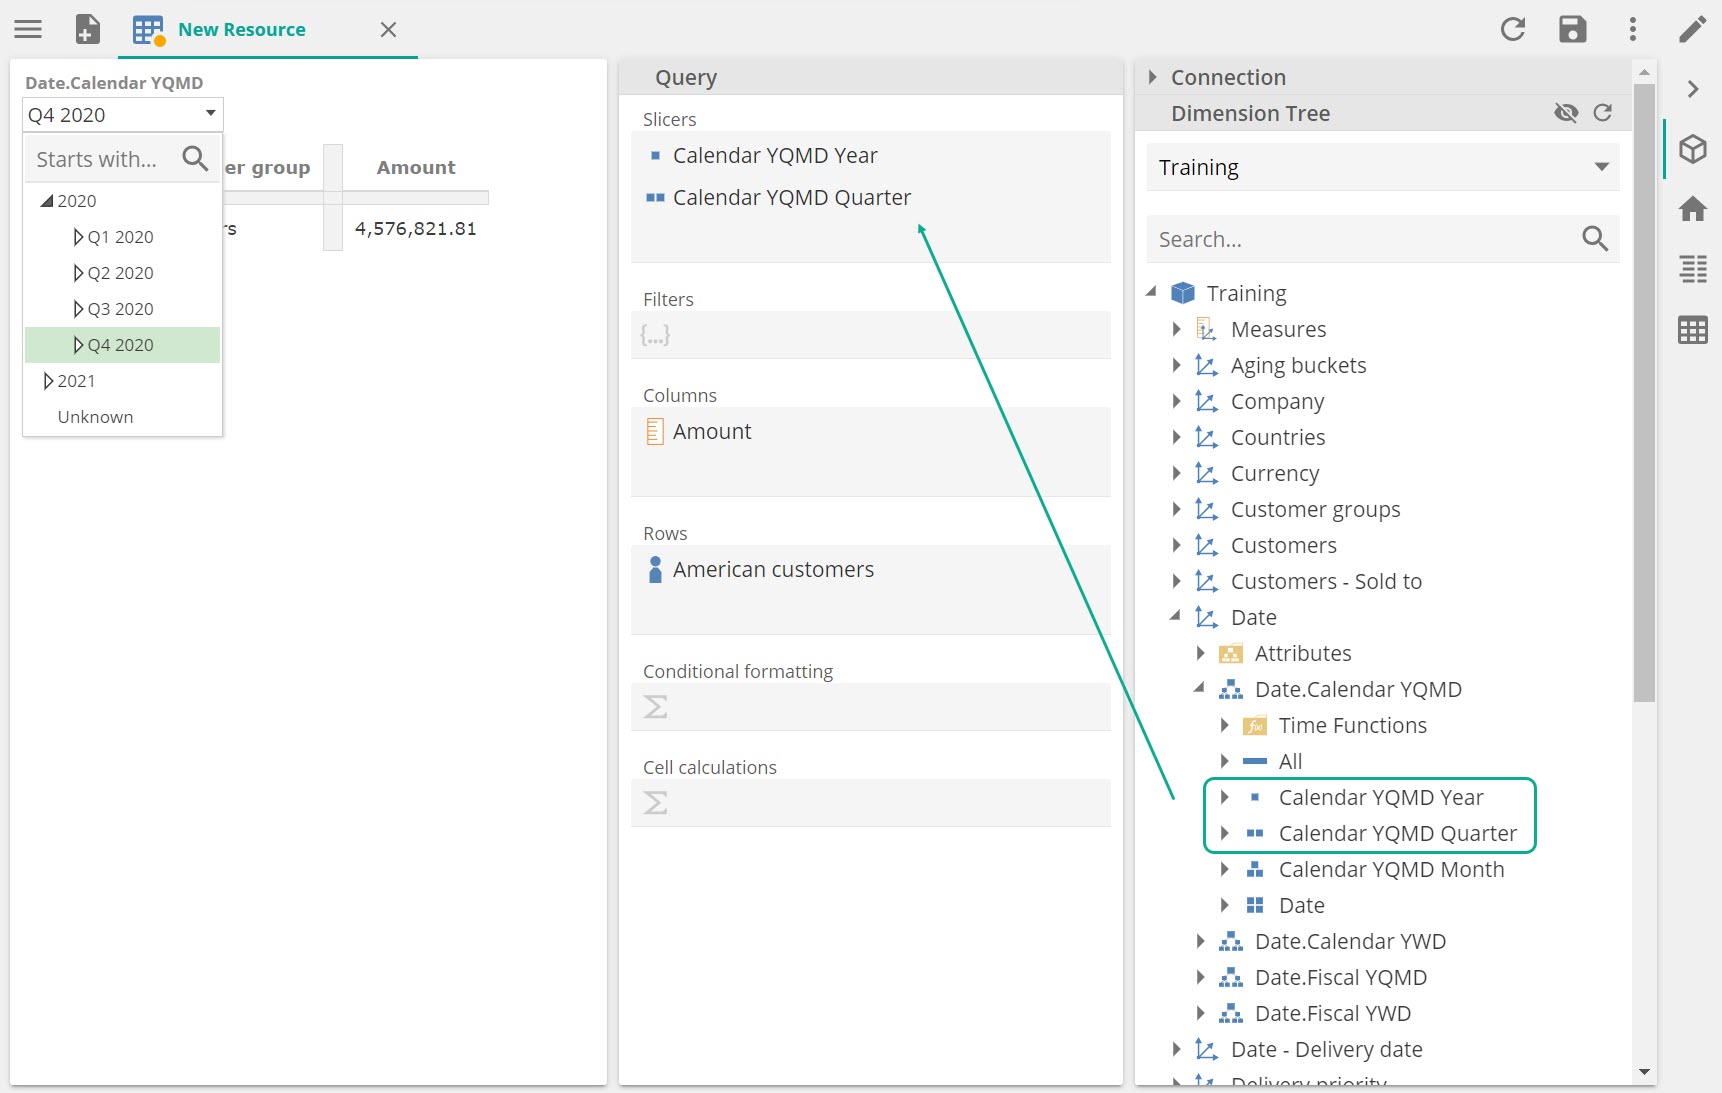
Slice the data set using the Slicers placeholder. Hover to slice using a date or date range, or drag hierarchies or levels directly into the placeholder.
Right-click the placeholder to select the Slicer Type.
Click Save. Specify a name and folder location for the analysis, and click OK
Note
By default, the pivot table is displayed using the table view.
To switch between Table or Chart view, use the toggles on the Home panel.
To drag multiple items, press and hold Ctrl while selecting items.
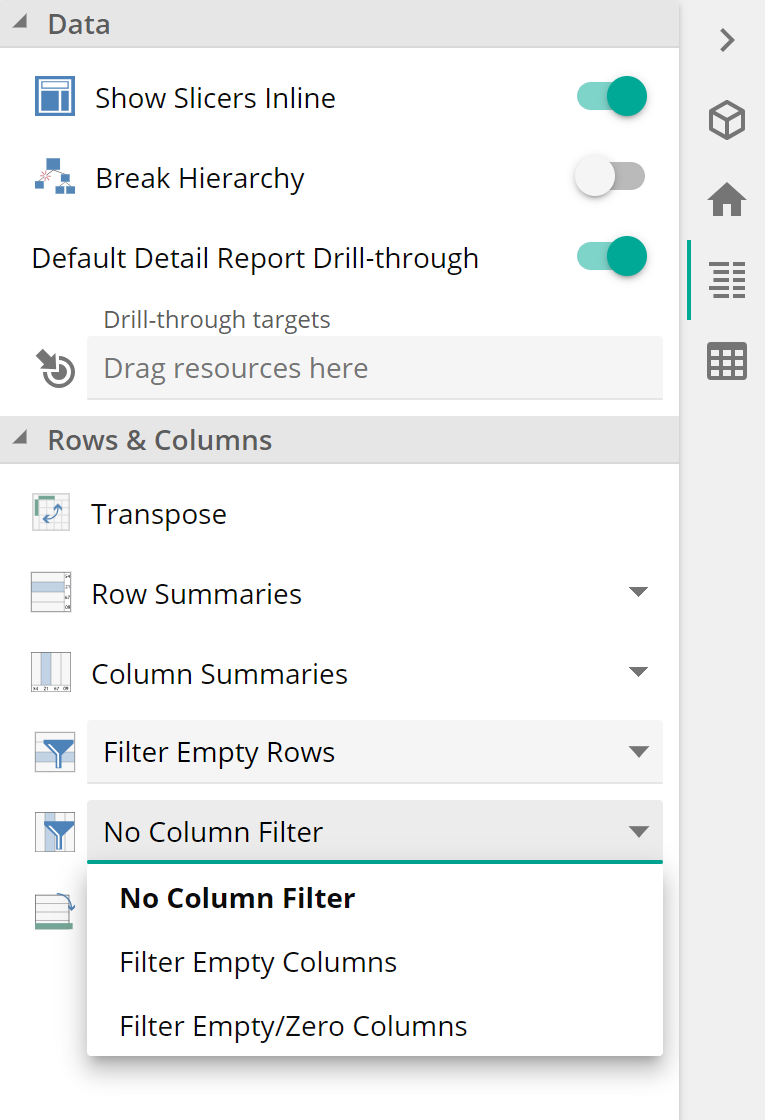
Filter rows or columns on a table
Open an existing analysis report.
Click the Data panel.
Click the Filter Column or Filter Row drop-down to filter empty or zero rows or columns.
 |
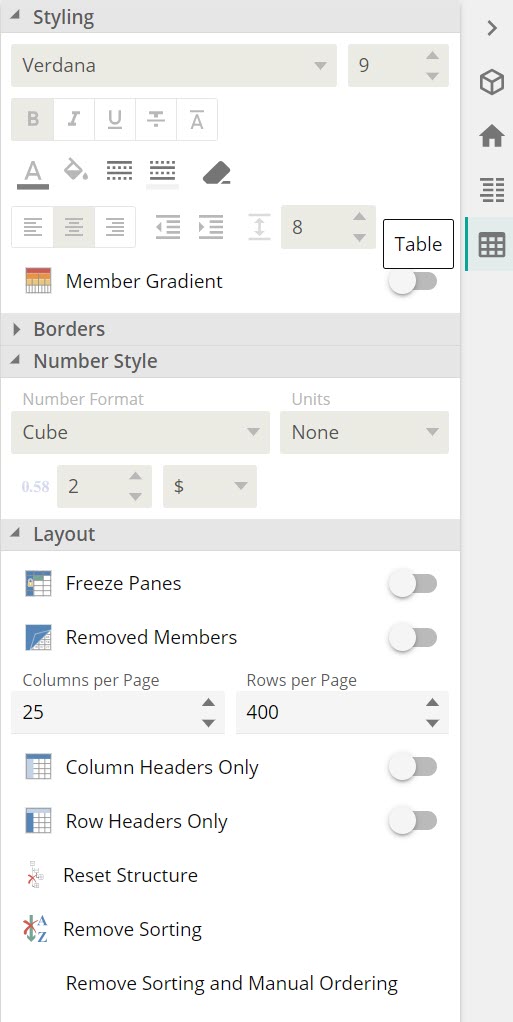
Format a table
On the Table Panel, various formatting options are available.
Available options are: Font, colors, background, alignment, margins, borders, number formatting and layout.
 |
Remove and restore members
Members in a pivot table can be removed and restored if necessary.
Right-click any member on analysis and click Remove Member.
Click Removed Members on the Table panel to see all removed members.
To restore the member, right-click and click Restore Member.
Add subtotals or grand totals to a table
Open the analysis in which to add subtotals.
Click Edit , and on the Data panel, click one of the following:
Column summaries: This provides access to column summary options.
Row summaries: This provides access to row summary options.
When a Subtotal option is active, clicking the other Column and Row options will not affect your analysis.
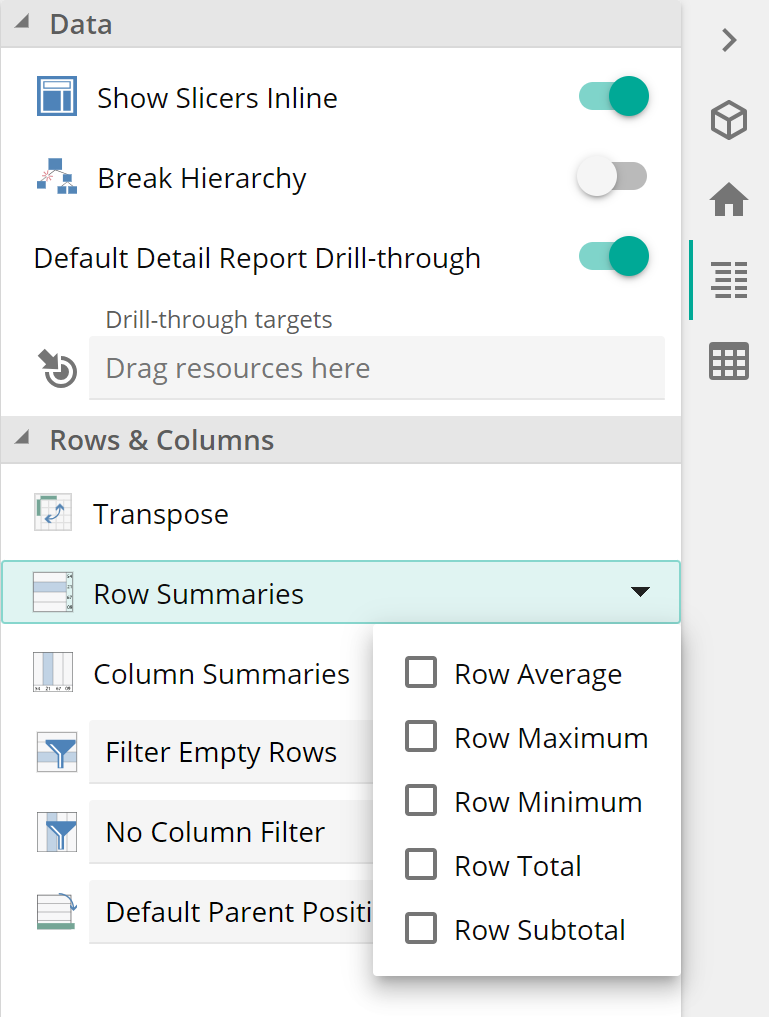
Click Column Subtotal or Row Subtotal in the list of additional options.
Click Save.
Conditionally format an analysis
Open analysis and click Edit.
Select a column to format.
From the Query window right click on the Conditional formatting placeholder and choose any option, e.g. Less Than.
Specify the value for which the formatting should apply/appear.
Change the color if required, and click Apply.
Click Save.
Add a drill-through target
Open the analysis requiring the drill through.
Double click on any cell or area in the source report you want further information on.
Format the new report.
Click Save.
Select the location to save the target, name the target and click OK.
Go back to the original analysis.
Click Edit.
Drag the saved report from the Resource Explorer to the Drill through target report placeholder.
Click Save.
Note
If more than one target report is specified, the first defined drill-through target report is used when double-clicking. Subsequent reports can be accessed by right-clicking on the cell.
Right-click in a cell to select a drill-through target in the context menu.
Add a sparkline to a table
Sparklines allow you to specify the numeric formula and overall time period displayed in the trend line chart.
Open the analysis you want to add the sparkline to.
Click Edit.
Right-click in a placeholder and select Visualization > Sparkline.
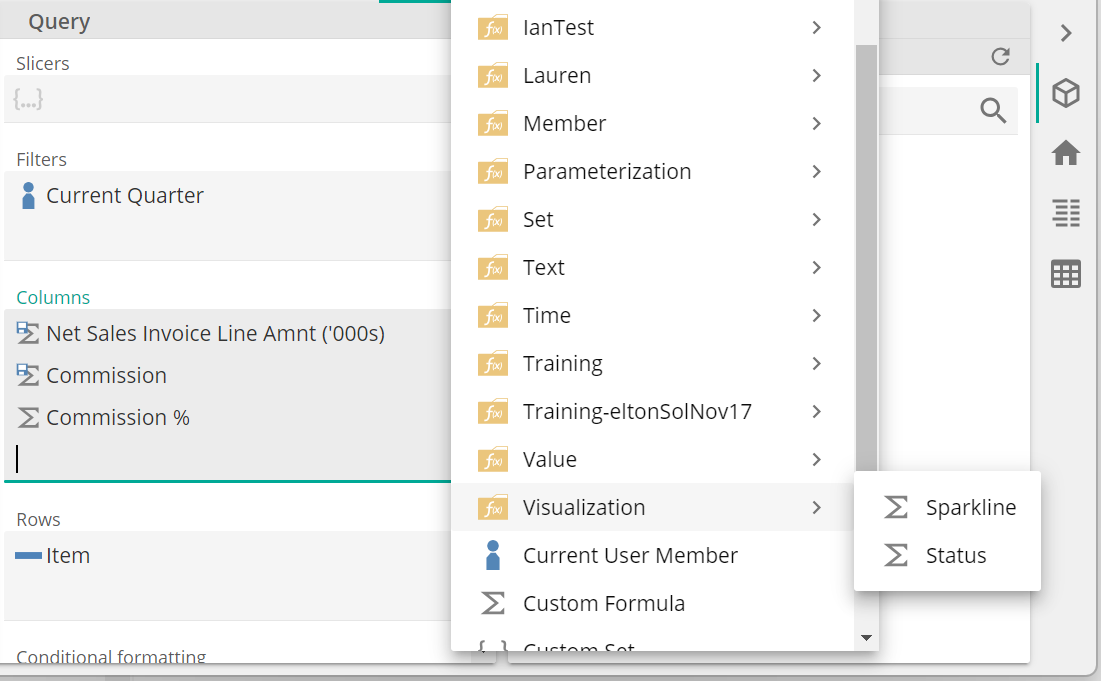
Configure the following information in the function's dialog box:
Add a custom name and description.
Specify how many periods to display in the Number of Data Points box. The default value (12) will show the last 12 months, including the current month, when Time Context is left blank.
Specify a measure or calculation in the Formula section.
Optional: Specify a time period to display in Time Context section. Leave empty to use the current period.
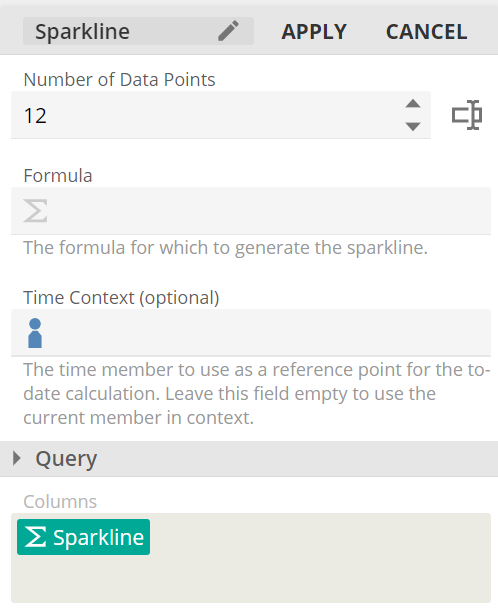
Click Apply.
Helpful links
Drill through in Data Hub analytics reference