Analysis Resource
Analytical reports are business reports that use qualitative and quantitative company data to analyze and evaluate data trends to support decision making.
Analysis reports have the ability to show data in a table format (similar to an excel pivot table), various types of charts and graphs, or a combination of both.
Analysis reports are easily created in Data Hub by dragging measure and dimension items from the Dimension Tree onto placeholders on the Design Canvas.
By default, analyses are created as tables.
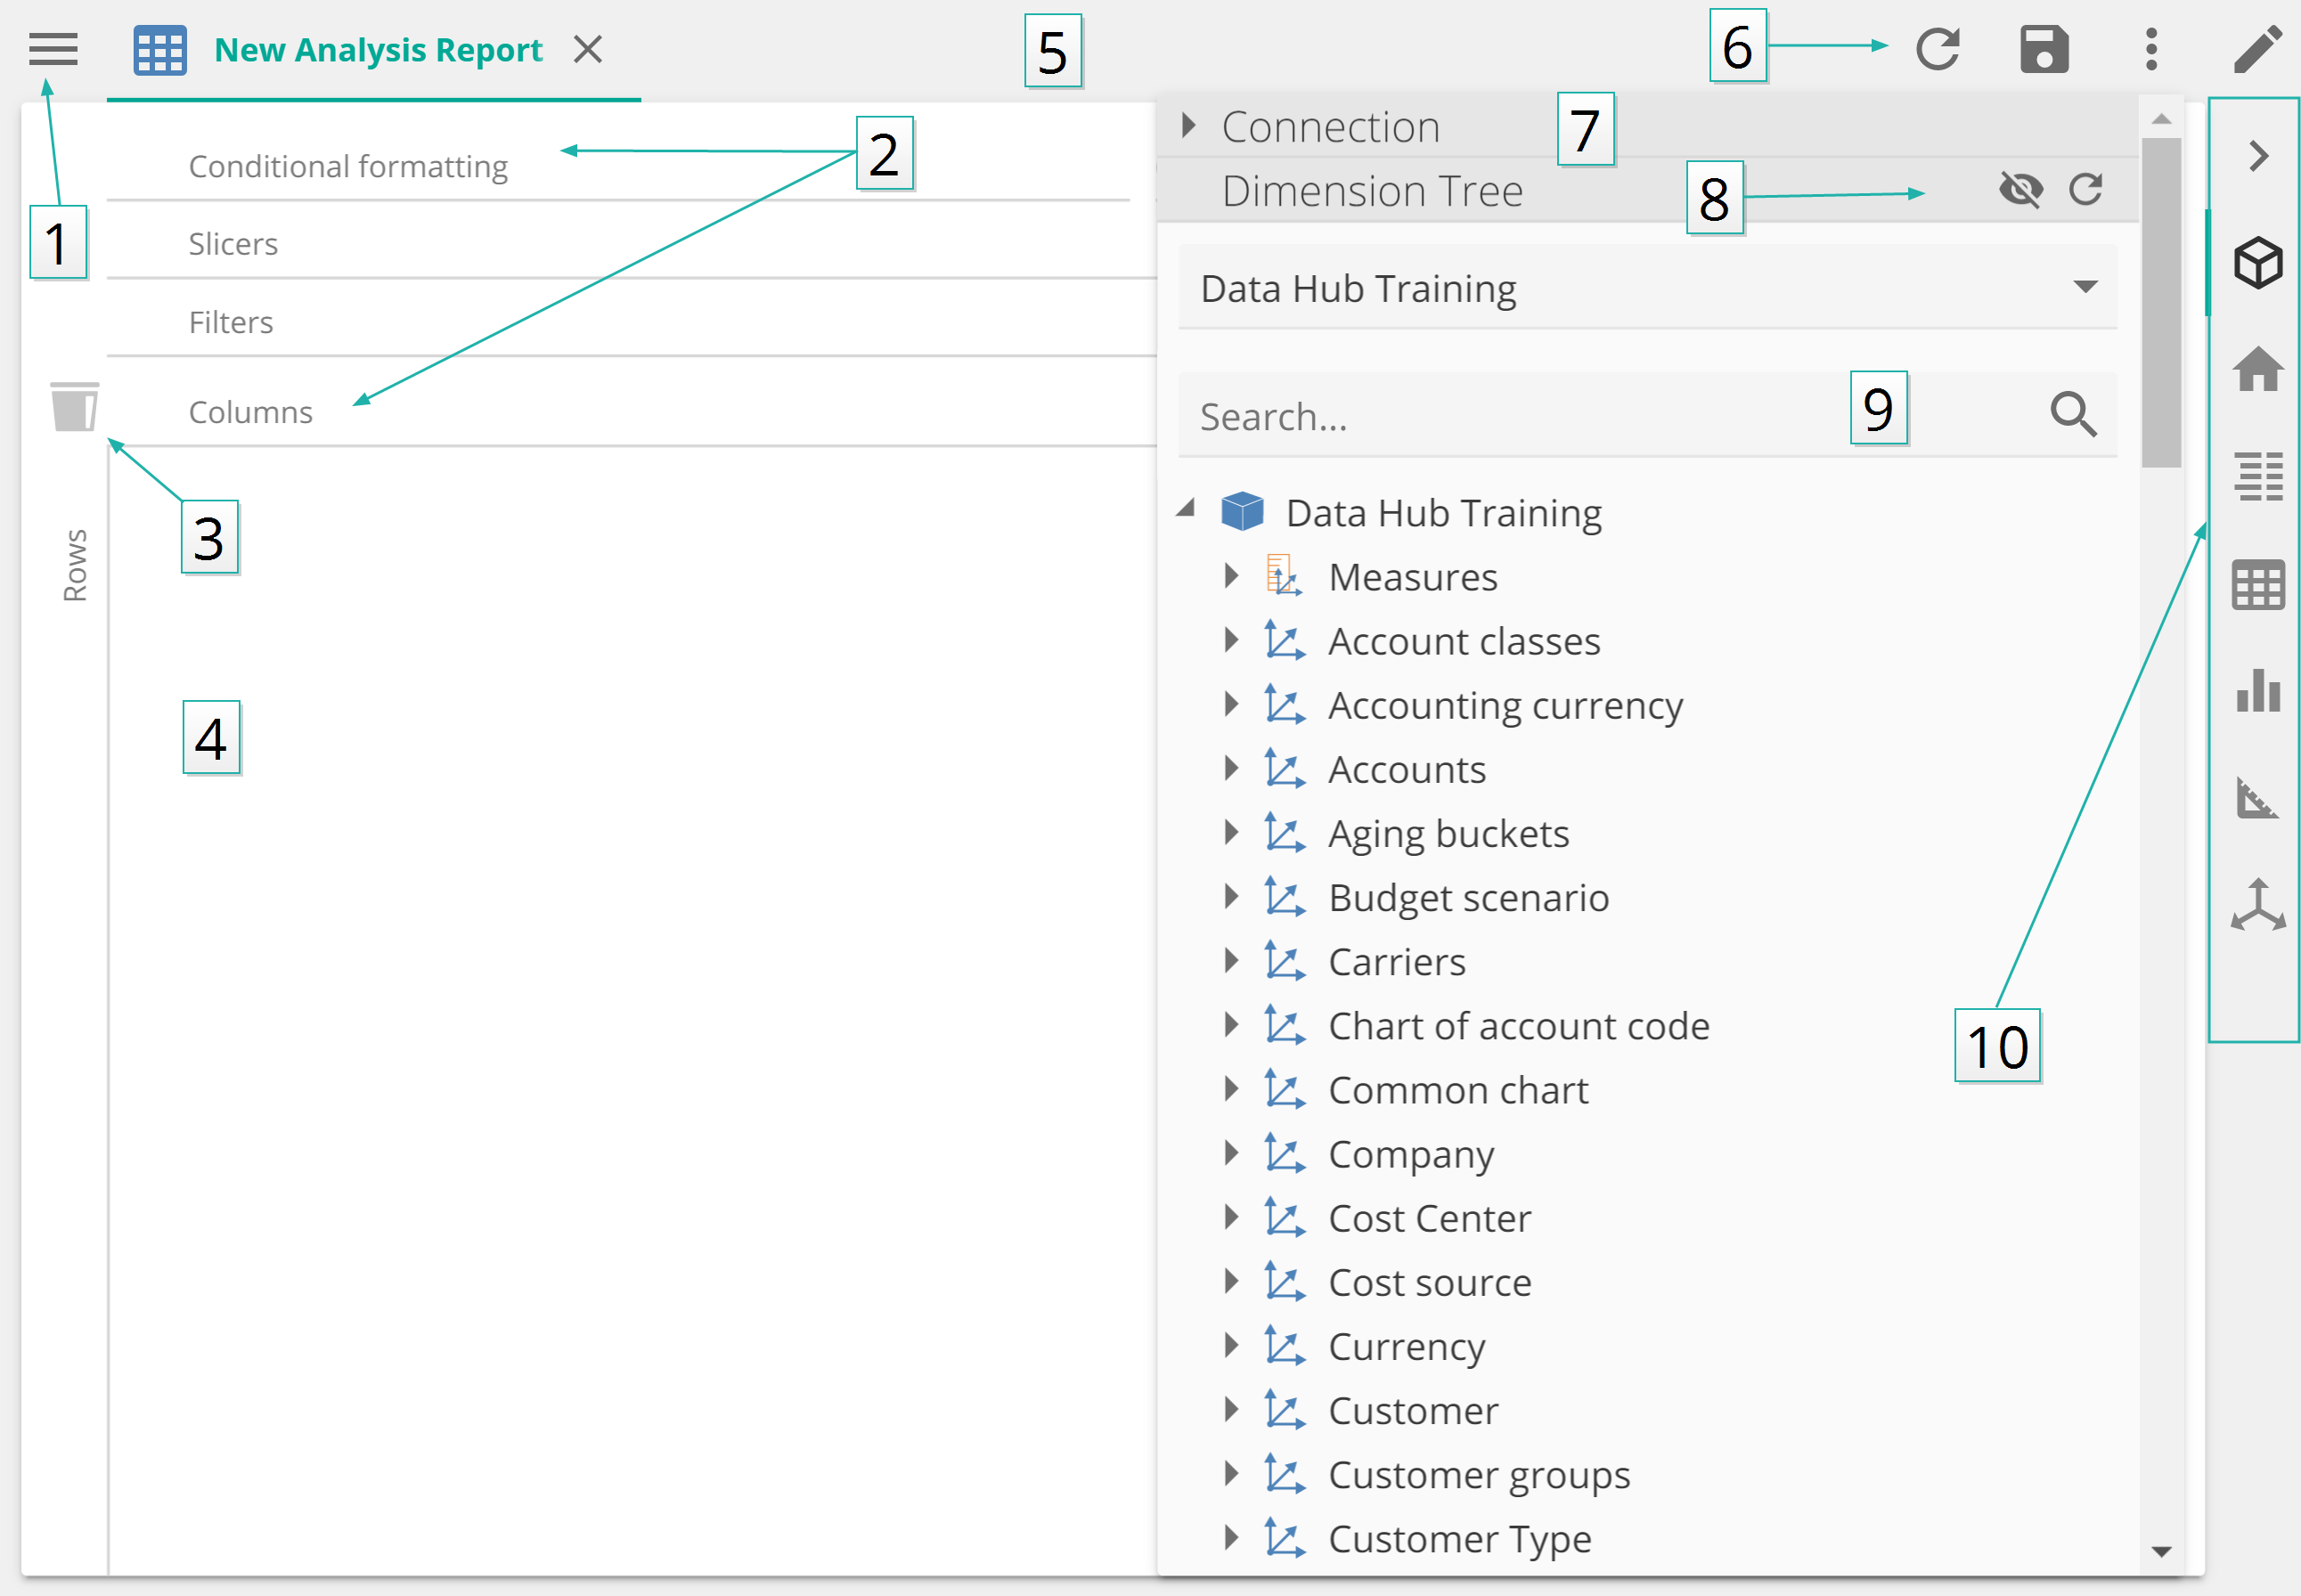 |
Resource Explorer
Placeholders
Drag items into the bin to remove from the analysis
Design canvas
Tabs bar
Tabs toolbar with tools
Connection details
Filter or refresh the Dimension Tree
Search the Dimension Tree
Design bar
Changing the way your analysis displays can be done on the Home design panel (Options are table, chart, or both). For additional formatting, use the Table and Chart design tabs from the design bar on the right of the screen.
Common table and chart formatting
Themes and color palettes
Themes are predefined sets of styling components like colors, shading and borders, used to quickly style analyses.
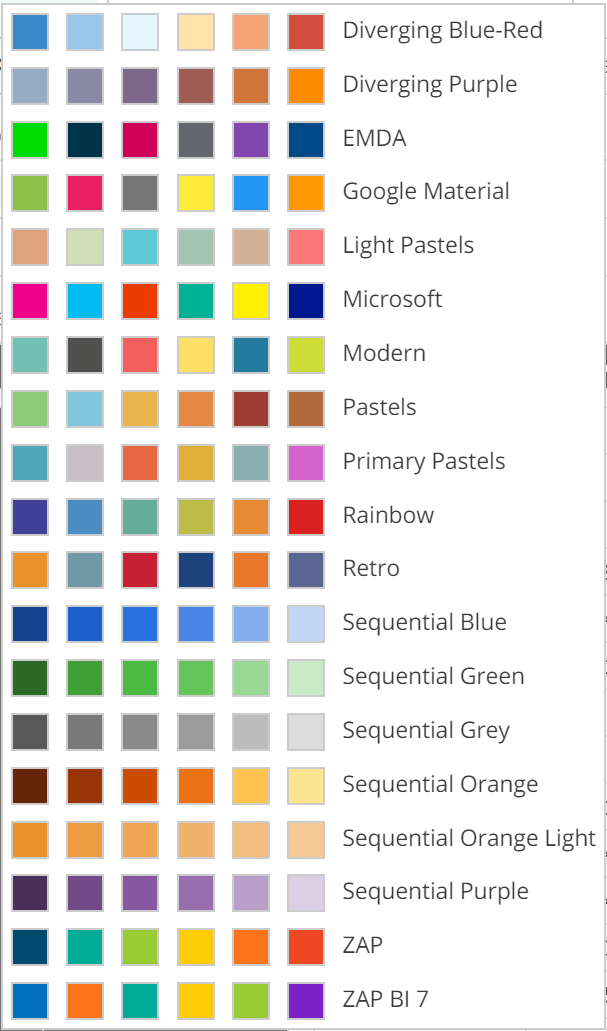
By default, resources in Data Hub are colored using a set of colors from a palette. You can select from a number of available palettes.
The color palette options are available from the Home design panel.
 |
Selecting a new color palette also updates the available colors in the Selection Color drop down on the Chart design panel (when working with charts) and the Font Color and Background Color styling options on the Table design panel (when working with analyses).
Conditional formatting
Conditional formatting allows users to specify customized cell colors, using color gradients and contrasts, based on field values. It can be applied to a variety of different types of data. Conditional formatting is configured in design mode of analysis Charts and Reports by hovering over the Conditional formatting placeholder.
This will display various types of formatting functions (e.g. Greater than, Smaller Than etc.). The formatting will be applied to all selected sells based on whether the value meets the specified conditions inside the respective function used.
Each Conditional Formatting function shares the following generic data input fields:
Name. This name will appear on the conditional formatting placeholder tab
Description. Optional text
Back Color. The background color of the formatted cells.
Forecolor. The text color of the entries in the formatted cells.
Cells to Format. Cell selections that will be formatted. If left blank, the entire analysis will be included.
When a function is opened, measure group and dimension items can be dragged from the Dimension Tree onto the placeholders inside the function.
Conditional formatting functions
Function specific data input fields are described with each function below.
Less Than - allows you to format selected cells that are less than a specified value.
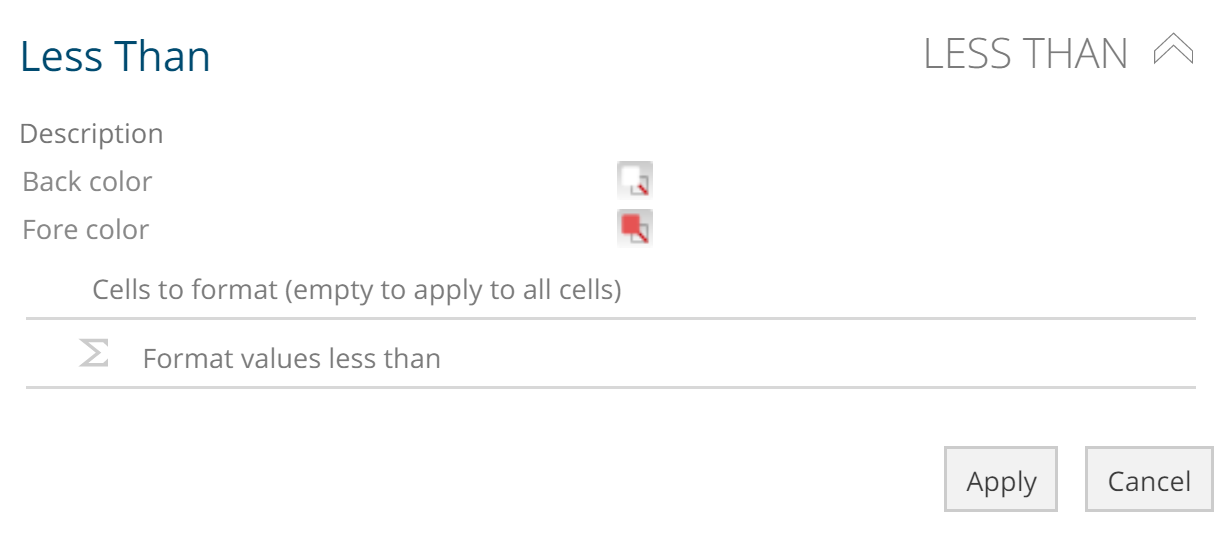 |
Format values less than - specify the "less than" value for the formatting.
Greater Than - allows you to format selected cells that are greater than a specified value.
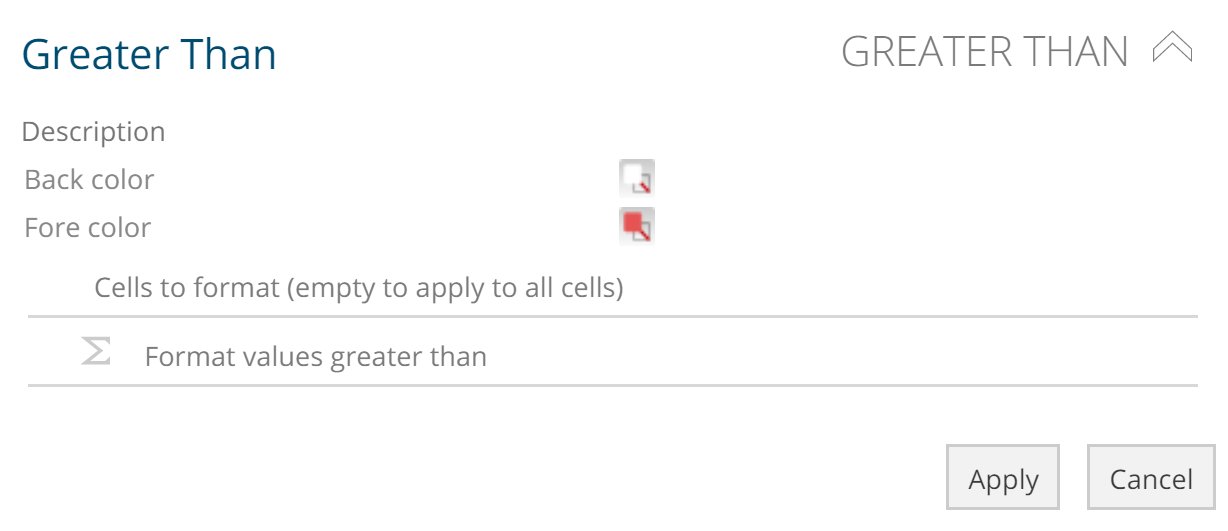 |
Format values greater than - specify the "greater than" value for the formatting.
Between (Range)
This option allows you format values included in a supplied range within specified cells.
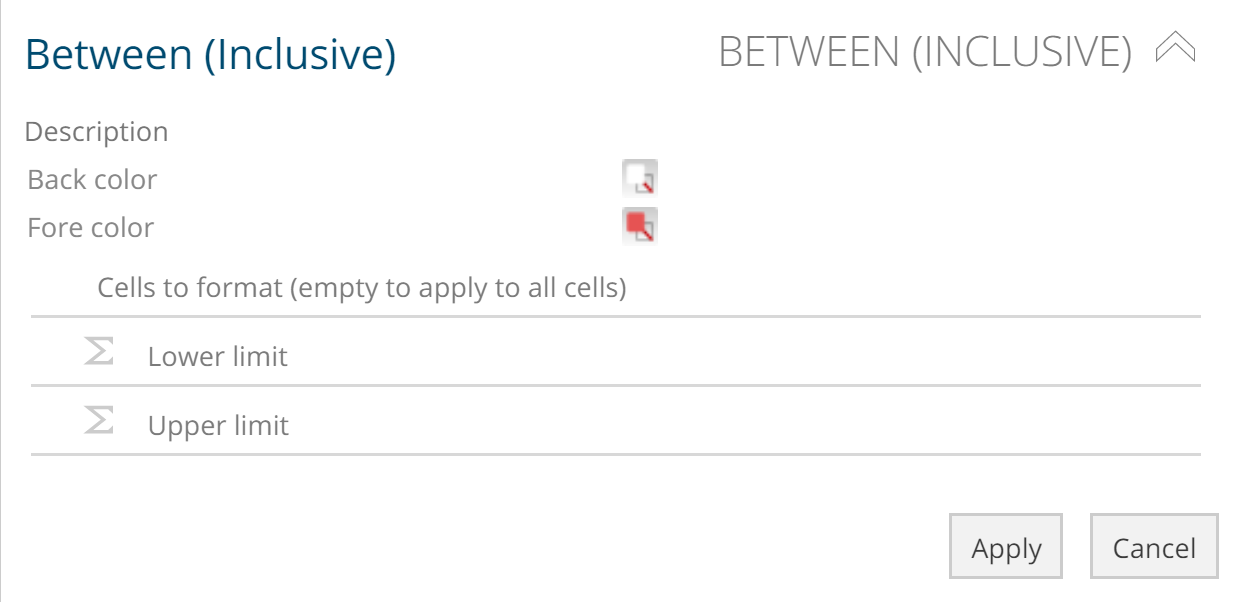 |
Lower limit - specify the lowest value of the range. Values greater than or equal to this value are formatted.
Upper limit - specify the highest value of the range. Values less than or equal to this value are formatted.
Equal to
This option allows you to format selected cells whose values are the same as (equal to) a specified value.
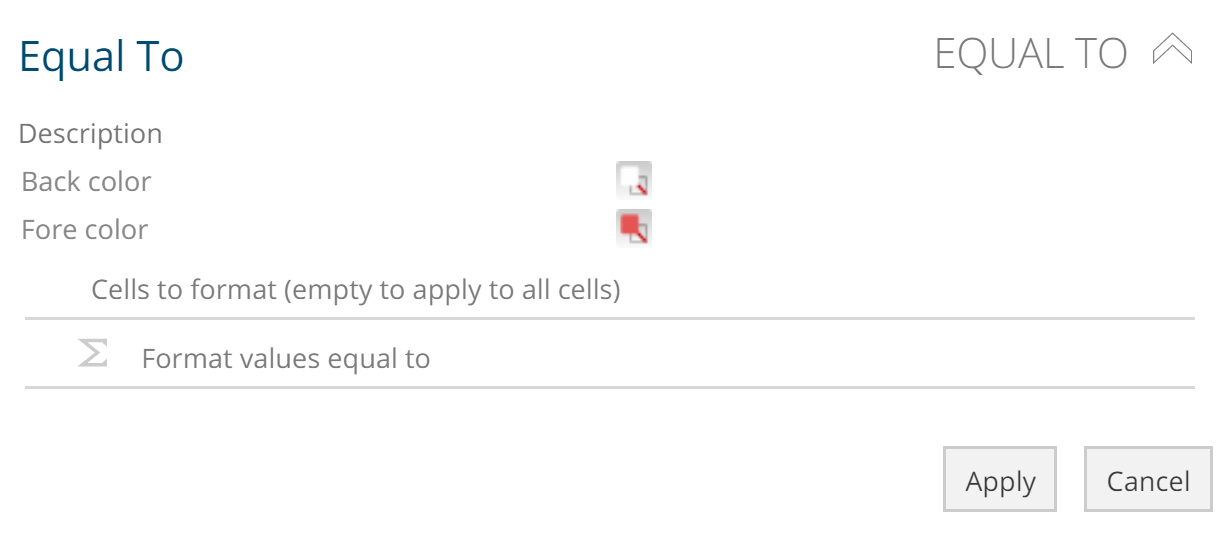 |
Format values equal to - specify the Equal To value for the formatting.
Heat map
This option allows you to apply a heat map to a group of selected cells.
A heat map formats the background color of all selected cells using a shade in the range defined by the To - and From color settings. Smaller values will be assigned a shade closer to the From color and larger values will receive a color closer to the To color setting.
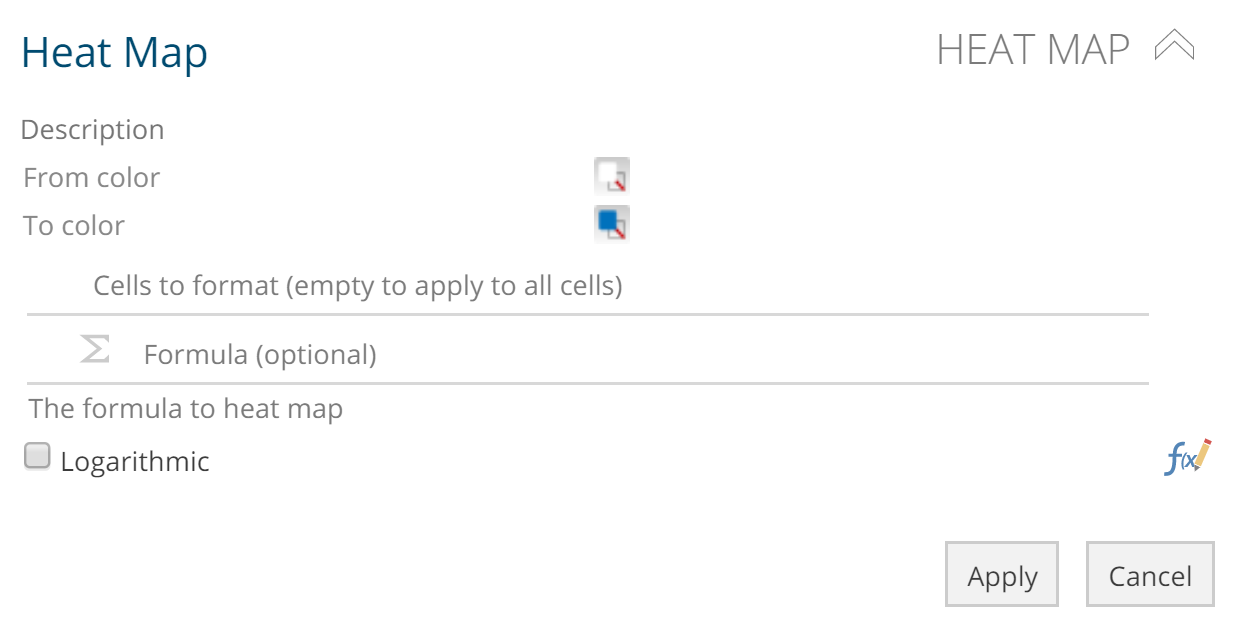 |
The following settings are available:
From color - the color that will be applied to the cells with the smallest values. Cells with values between the minimum and maximum cell values in the heat map will have a color blended from the From color and To color.
To color - the color that will be applied to the cells with the largest values. Cells with values between the minimum and maximum cell values in the heat map will have a color blended from the From color and To color.
Formula - controls the formatting of the corresponding resource based on a different measure or calculation to the one defined in the Cells to format placeholder. If not specified, the measure or calculation defined in the Cells to format placeholder is used. This setting is optional.
Logarithmic. Your heat map will use color intervals corresponding to orders of magnitude (log10), rather than a standard linear scale.
Custom heat map
This option allows you to apply a custom heat map to a group of selected cells. Unlike default heat maps, you can specify a maximum and minimum value for the formatting.
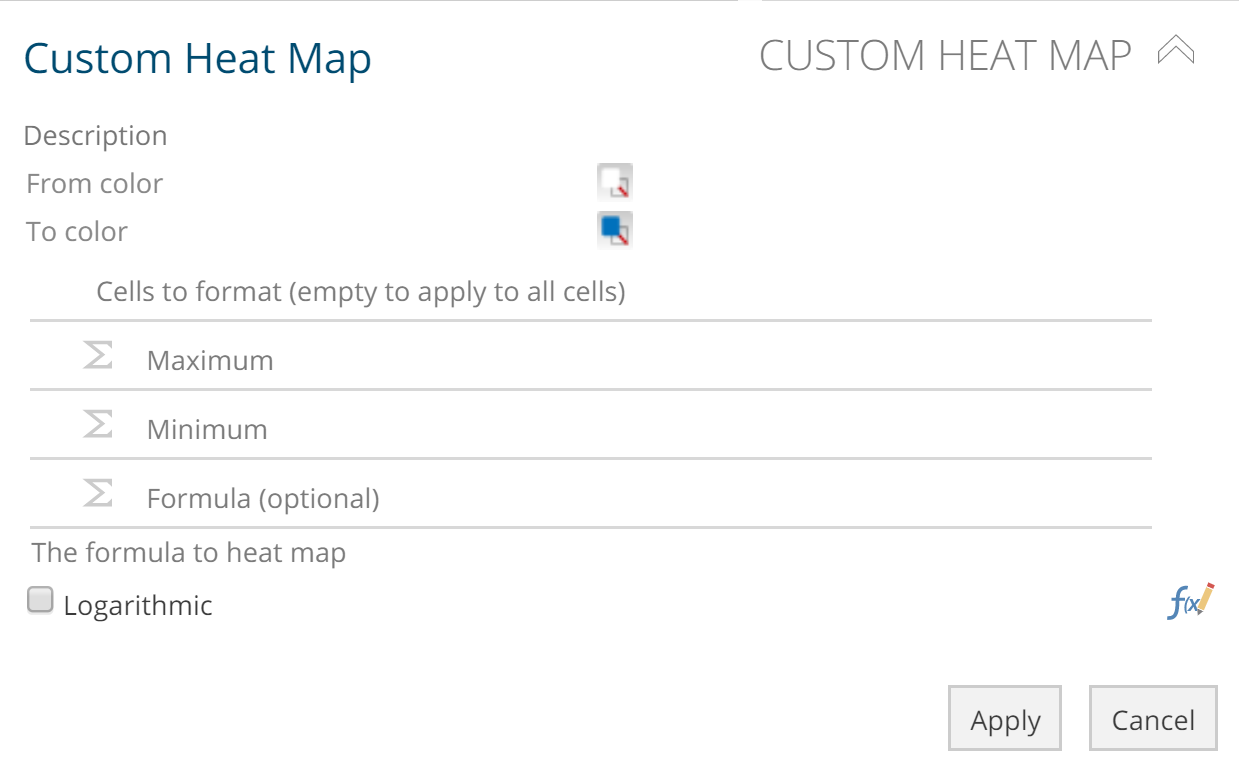 |
The following settings are available:
Maximum - specify the maximum value for the heat map. Cells with a value greater than or equal to this value will have the To color applied.
Minimum - specify the minimum value for the heat map. Cells with a value less than or equal to this value will have the From color applied.
Formula - controls the formatting of the corresponding resource based on a different measure or calculation to the one defined in the Cells to format placeholder. If not specified, the measure or calculation defined in the Cells to format placeholder is used. This setting is optional.
Logarithmic - Your heat map will use color intervals corresponding to orders of magnitude (log10), rather than simply a standard linear scale. This option may be useful when you have a wide range of values and a few large values obscure the differences between the smaller ones, or you need to focus on multiplicative, rather than additive relationships between the numbers, or you want to study the rate of change of the values rather than their absolute values.
Maximum value
This option allows you to format the cell containing the maximum value in a selected range of cells.
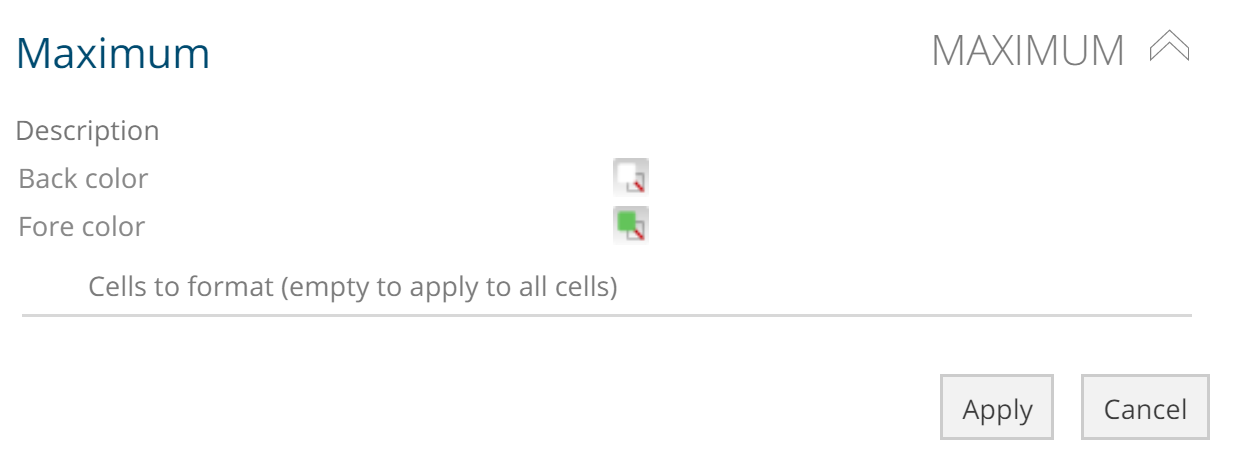 |
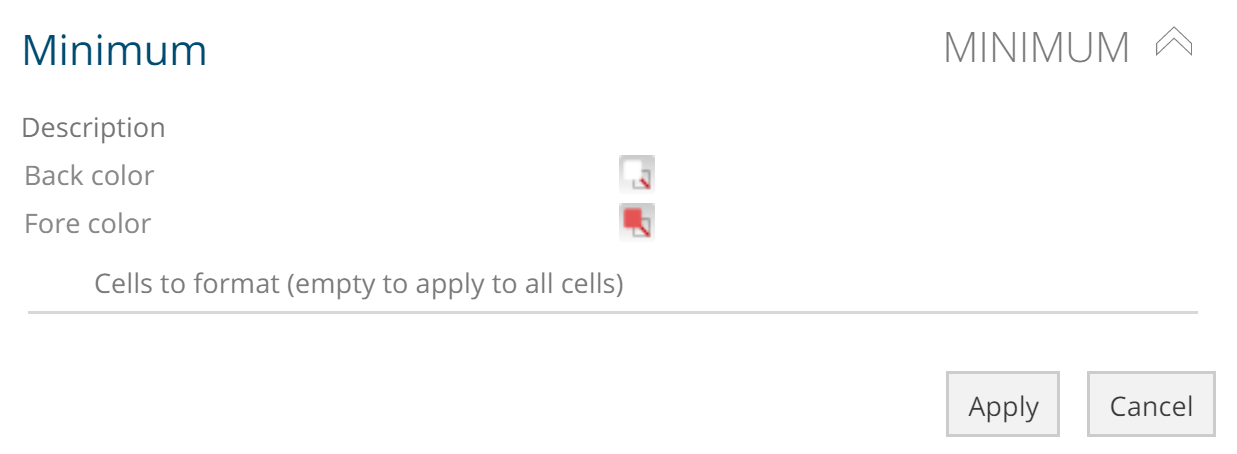
Minimum value
This option allows you to format the cell containing the minimum value in a selected range of cells.
 |
Custom conditional formatting
This option allows you to define customized conditional formatting, using a Boolean expression, for a specified group of cells. Only cells for which the Boolean expression is true are formatted.
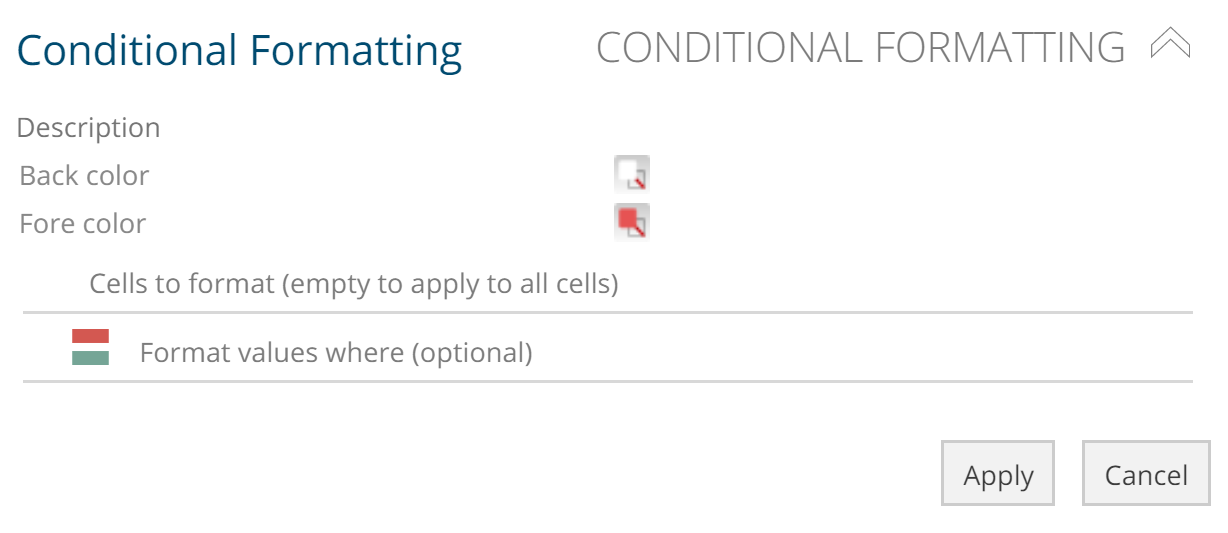 |
Format values where - specify a Boolean expression to control which analysis cells are formatted. Only cells for which the Boolean expression is true are formatted. If nothing is defined in this placeholder, all selected cells are formatted.
Number formatting option
This option allows you to specify the number or date format used for a specified group of cells. Only cells for which a specified Boolean expression is true are formatted.
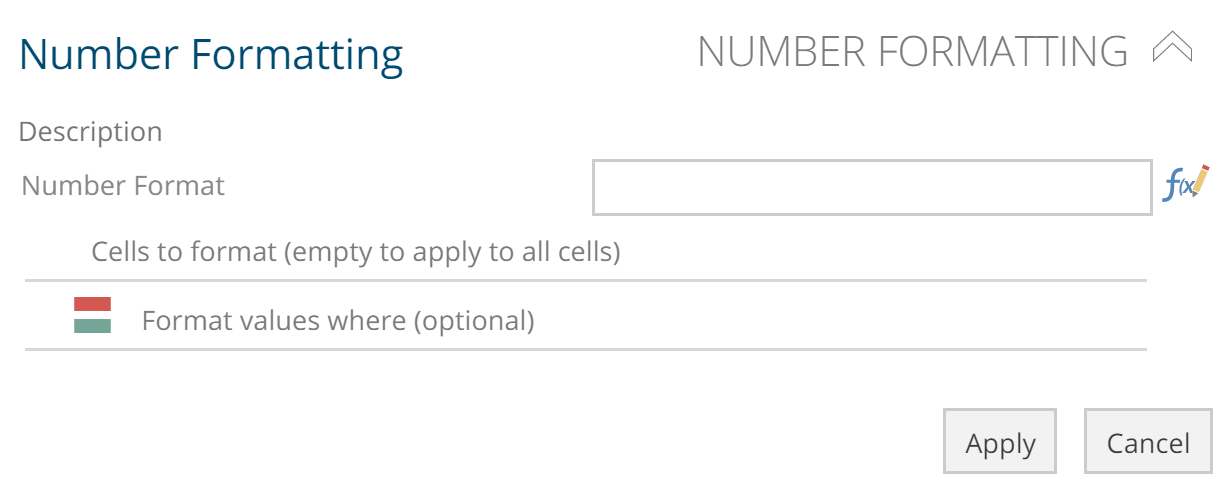 |
Number Format - specify the custom number or date format string to apply.
Format values where - specify a Boolean statement to control which analysis cells are formatted. Only cells for which the Boolean expression is true are formatted. If nothing is defined in this placeholder, all selected cells are formatted.
Drill through targets
Drill through targets are place holders on an analysis report or analysis chart (source report) that may be linked to a detail report created with information related to the source report.
Canceling a query
Executing analyses, can sometimes take a long time to return results due to long-running main queries. A Cancel Query button appears on the Tabs Toolbar, which allows you to manually cancel a long-running query. When the button is clicked, the main report query is immediately canceled.
Note
Data Hub will automatically cancel main queries to improve overall application performance. A common scenario where this will occur is when a slicer is changed while a previous query is still being executed.