Data Hub Analytics design basics
Design mode
Design mode for analysis reports can be opened in two ways:
Open a new analysis.
Open an existing resource and click Edit.
Note
This will only be possible if the user has been assigned a designer-type role.
Design mode provides the ability to create and customize analytical reports. Use design mode to change data by connecting to cubes, styling and formatting by using the various design panels on the design bar. Analyses can also be shared in various ways using the resource options menu.
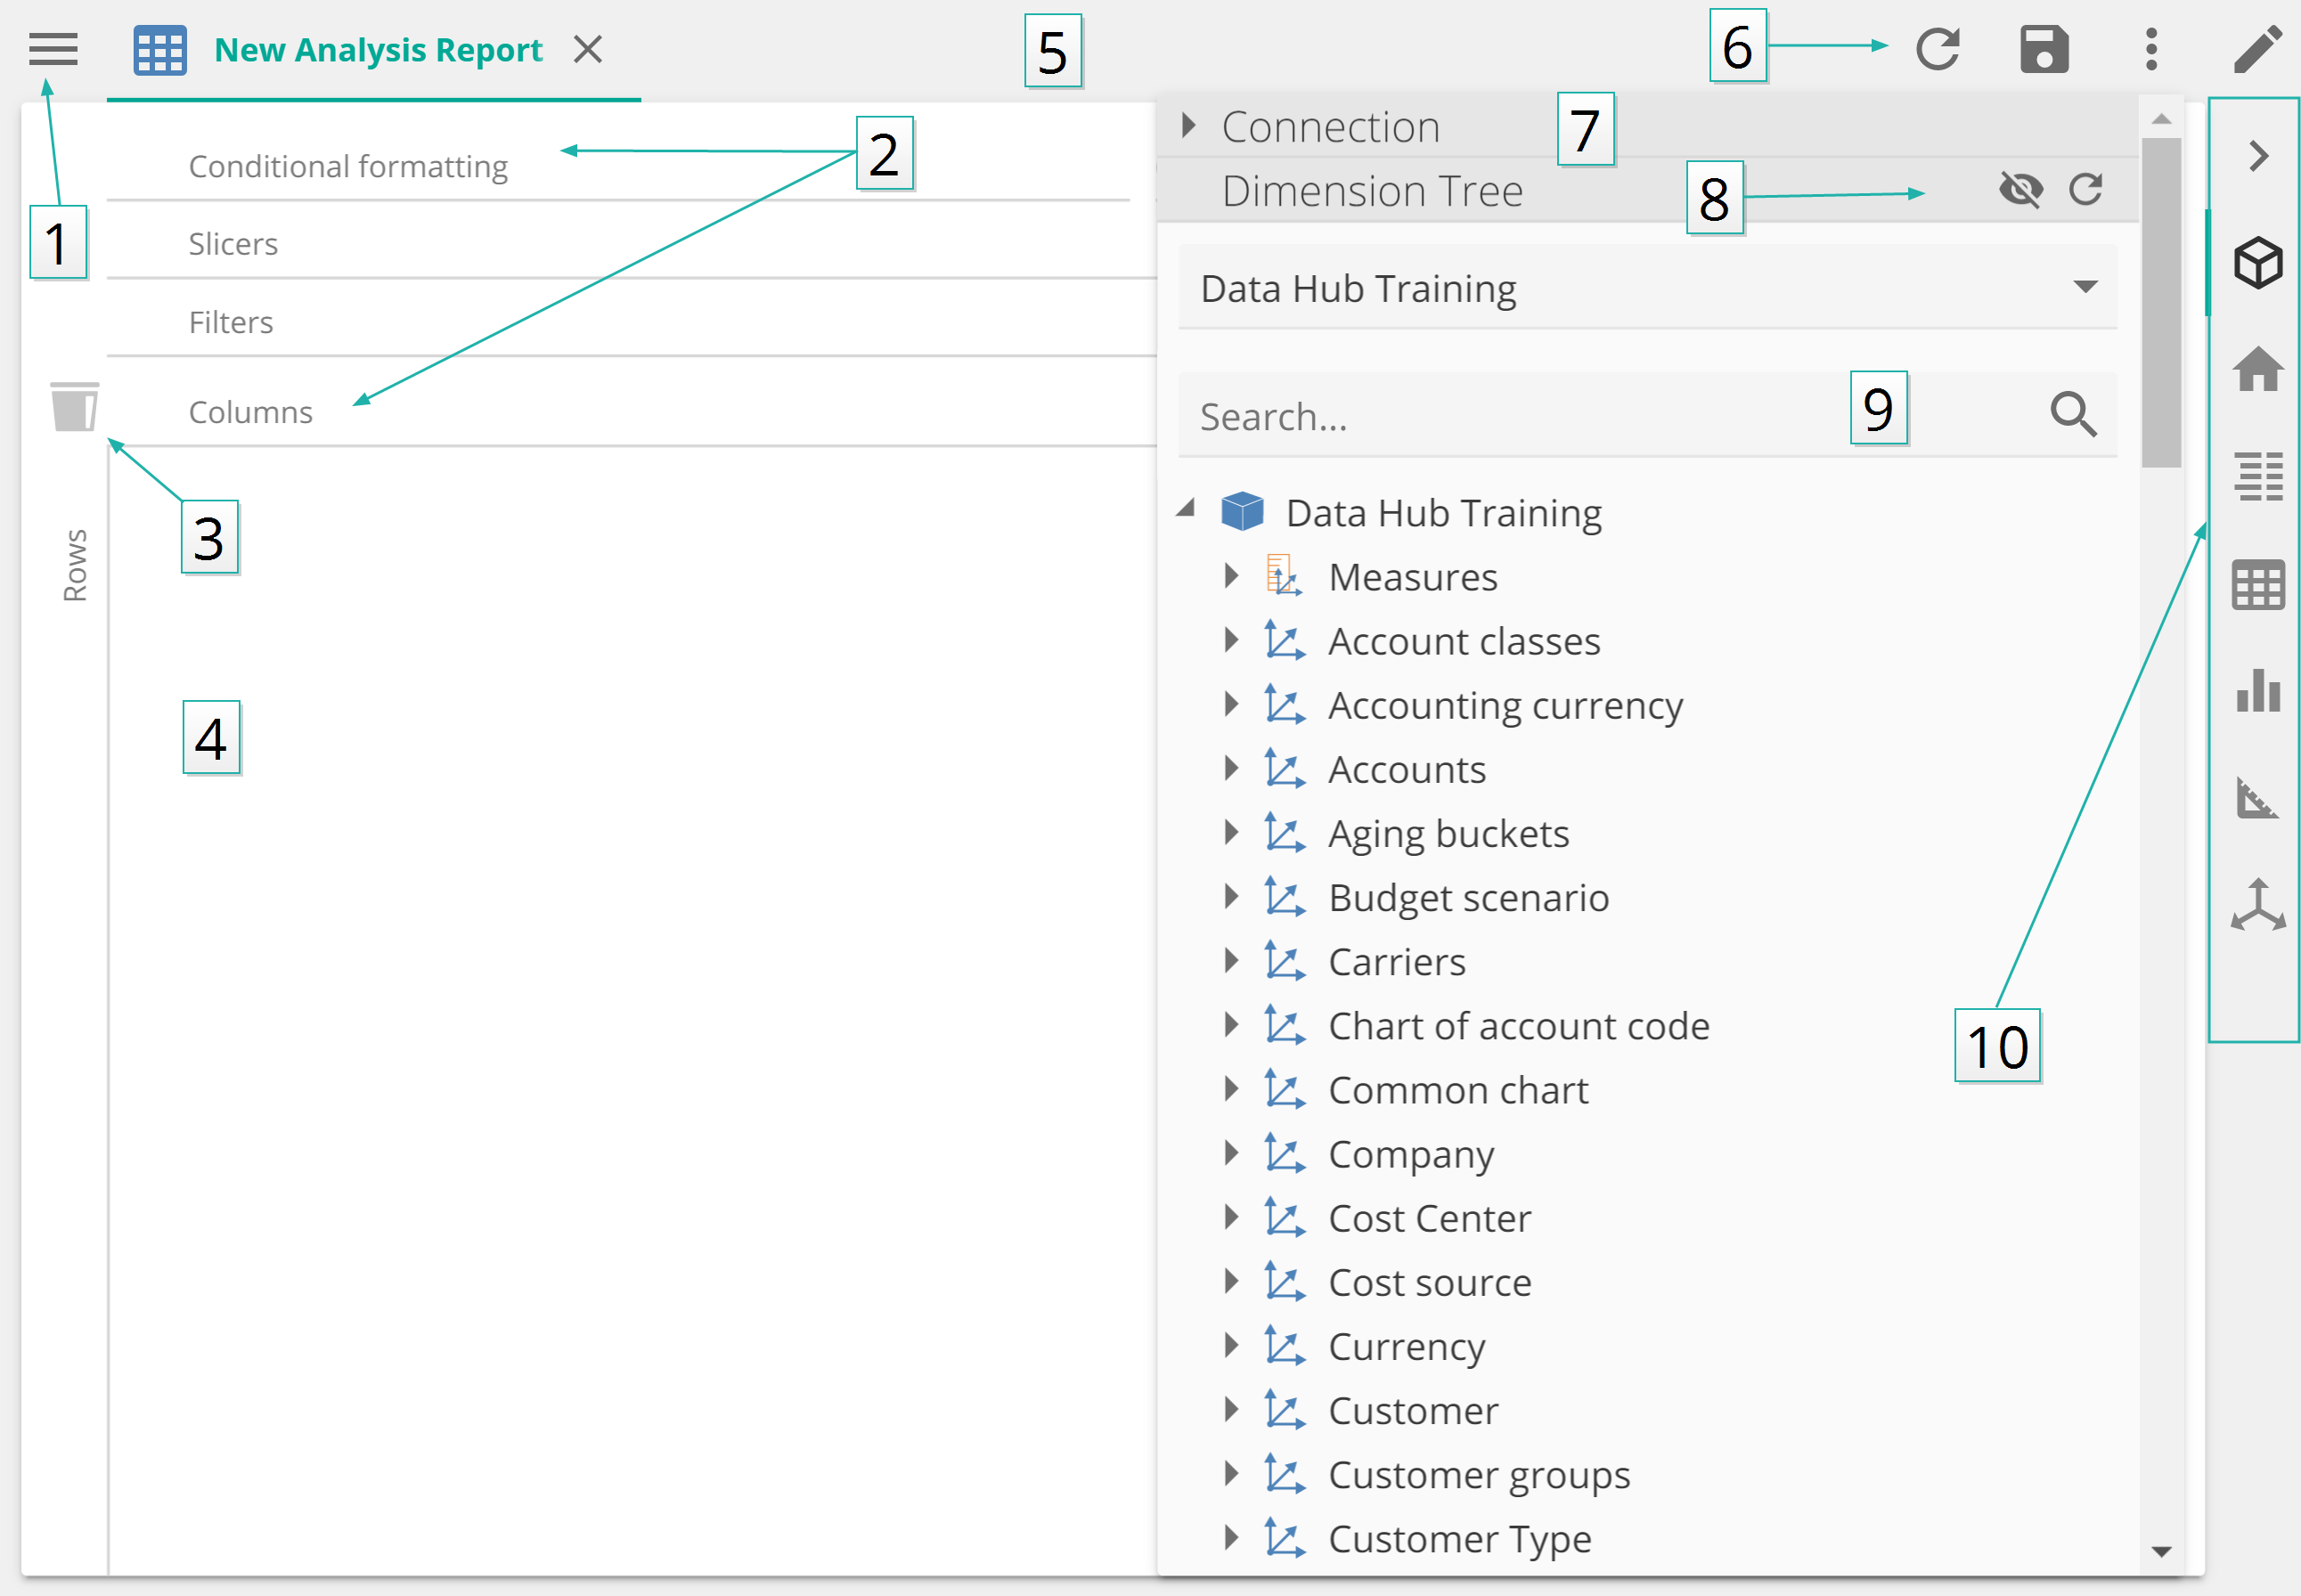 |
1. Resource Explorer
2. Placeholders
3. Drag items into the bin to remove from the analysis
4. Design canvas
5. Tabs bar
6. Tabs toolbar with tools
7. Connection details
8. Filter or refresh the Dimension Tree
9. Search the Dimension Tree
10. Design bar
Dimension tree
The Dimension Tree provides a hierarchical representation of the cube, made up of data elements such as Measure Groups, Measures, Dimensions, Attributes and Members. These elements can be dragged into placeholders, or used to create functions within the analyses.
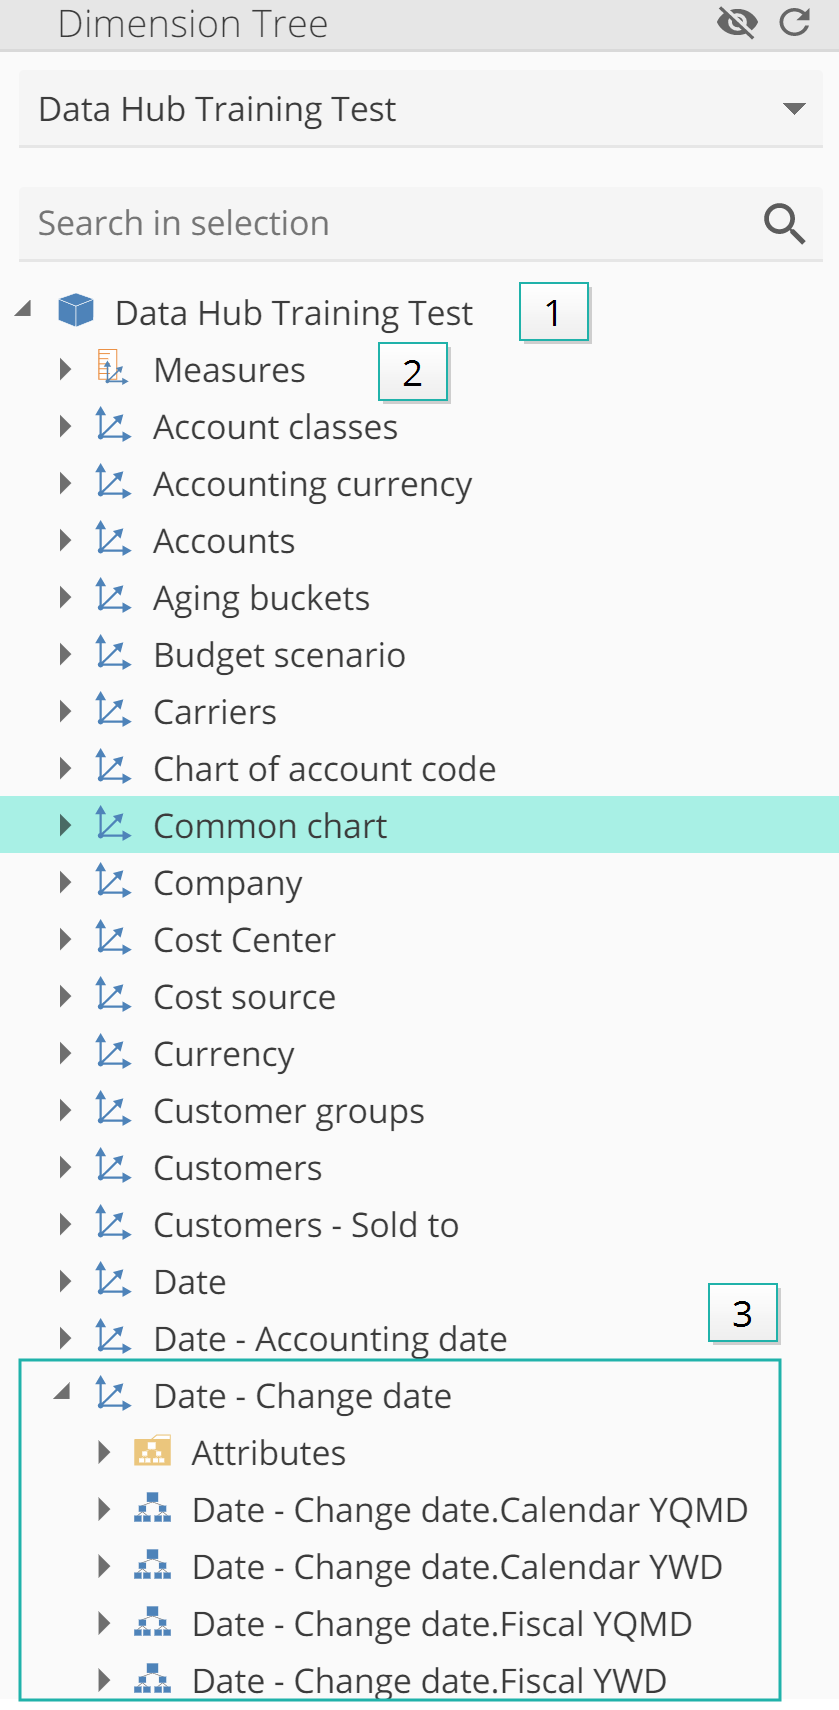 |
1. Cube name.
2. Measure.
3. Expanded dimension.
Dimension tree elements and icons
Icons used in the Dimension Tree for components referenced in the cube display as follows.
The type column indicates the component's field type, if it is used in a function or in a resource placeholder. For example, a Level component can be used in a function field that requires a 'Set'.
Where a type is not specified, the component is used for organization only (e.g. a folder) and cannot be used in a resource.
Dimension Tree Elements
Name | Definition | Icon | Field type | |||
|---|---|---|---|---|---|---|
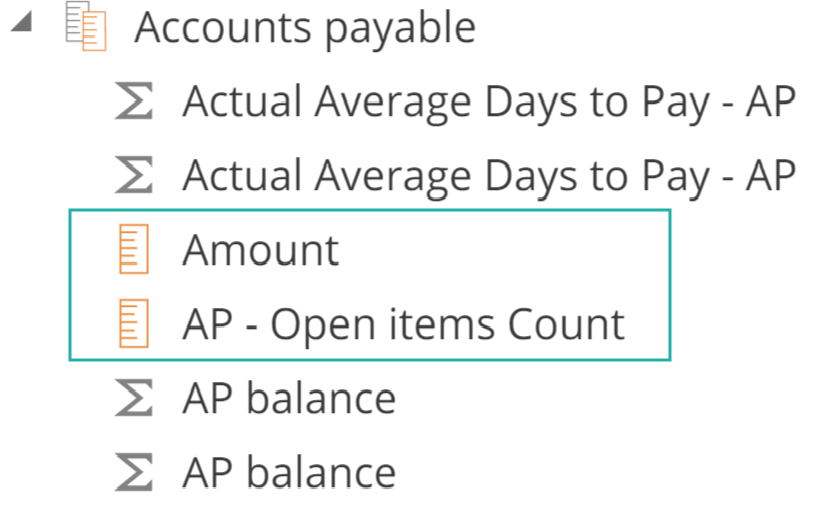
Measure | Any numerical value that can be used in a calculation (e.g. sum) is a measure. When building an analysis report, it is best practice to start with measures first. Once a measure has been placed on the rows or columns placeholders, the dimension tree will refresh and only display dimensions related to the selected measure. |
| Value | |||
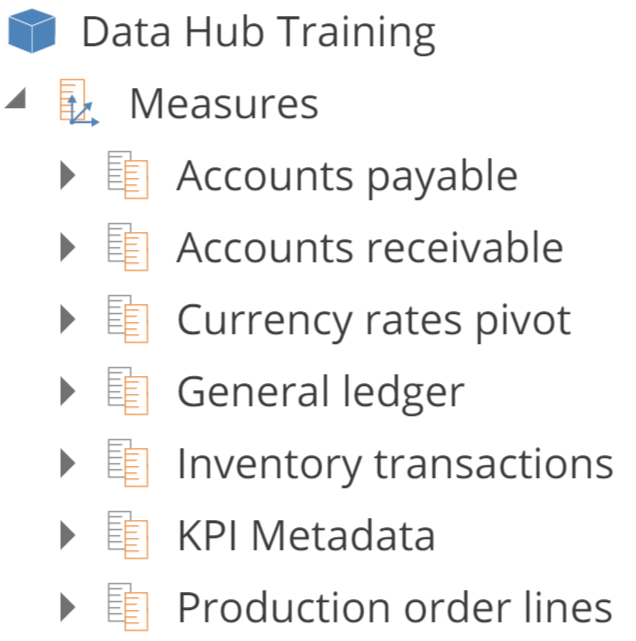
Measure Group | Measure Groups are collections of related measures. Placing a measure group on the rows or columns placeholders will show all the measures from that group in the results.
|  |
| Set | ||
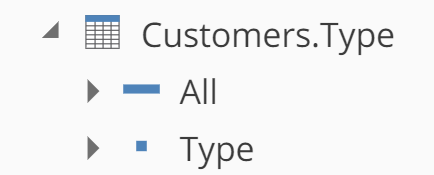
Attribute | This is a field or a data record whose values cannot be used for measurement, but can be used to slice or filter data. An example of an attribute for a store record may be a city.
|  |
| Member | ||
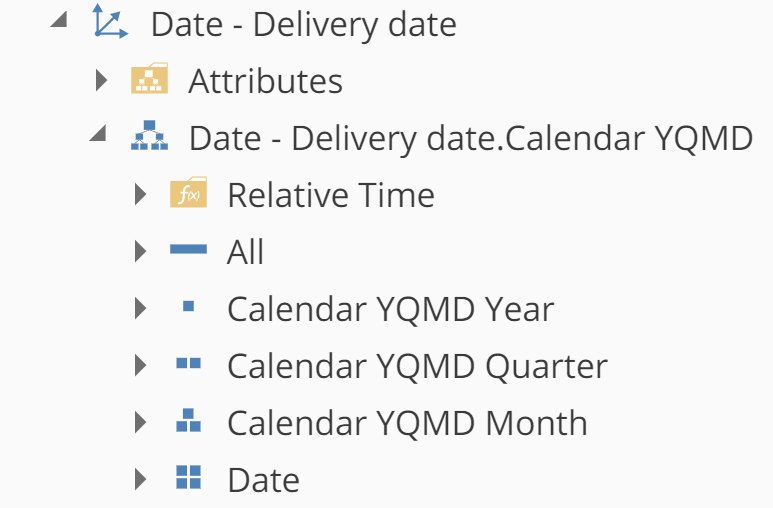
Hierarchy | An arrangement of data consisting of sets and subsets where every subset is of lower rank than the set. An example of a date hierarchy levels: Level 1 - Year Level 2 - Quarter Level 3 - Month Level 4 - Day |  |
| Member | ||
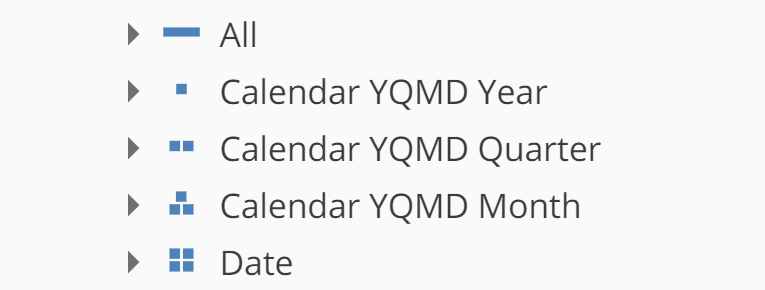
All Level: | All hierarchies and attributes display this single value, representing all the members in the hierarchy |  |
| Set | ||
Level 1 |  | Set | ||||
Level 2 |  | Set | ||||
Level 3 |  | Set | ||||
Level 4 |  | Set | ||||
Level 5 |  | Set | ||||
Level 6 |  | Set | ||||
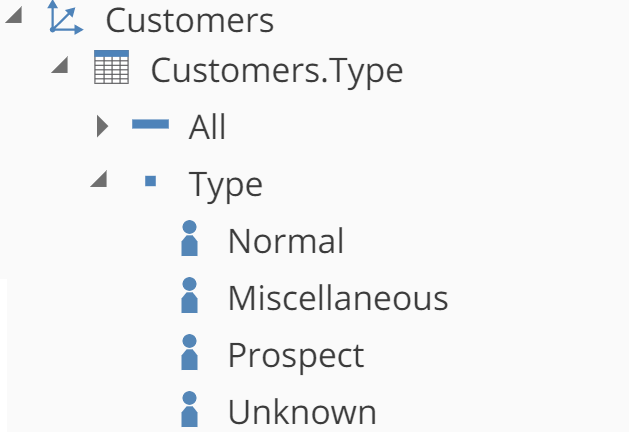
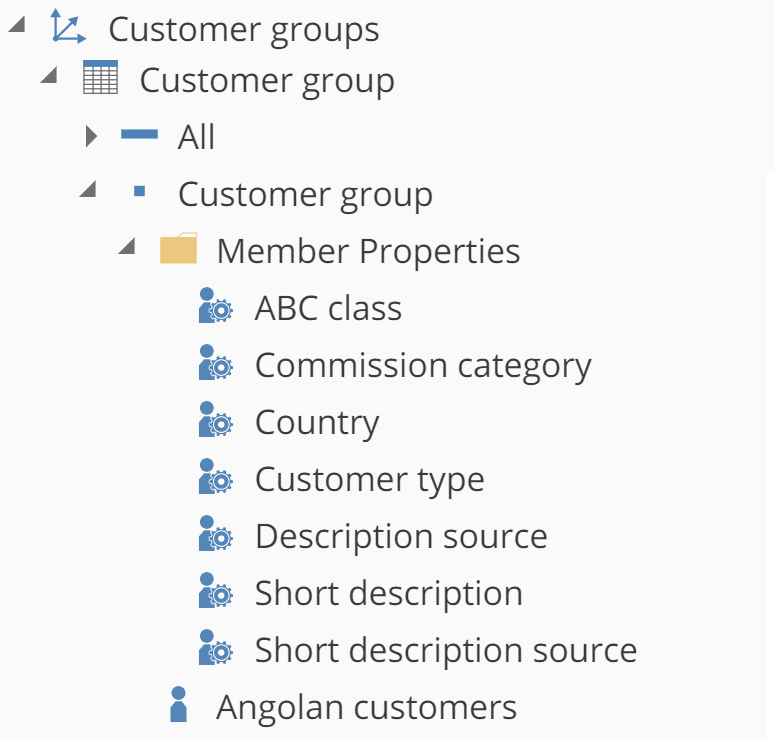
Dimension | Dimensions are groups of related attributes and hierarchies. A customer dimension may contain a Customer Group hierarchy and attributes about the customer(e.g. Company Name, Customer Name, Customer Type) |  | Member | |||
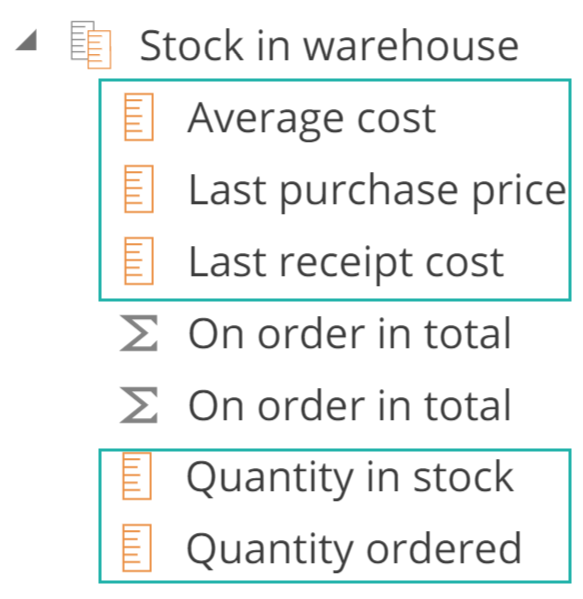
Member | Attributes have unique values which are referred to as members, for example the attribute customer type could have "prospect" as a member. Members appear underneath levels, inside attributes and hierarchies. |  |
| Member | ||
Member property | Member properties provides additional information for members, but cannot be used to slice or filter data. (For example descriptions, class and type). Member properties are typically unique. |  |
| Value | ||
Folder | Folders group elements of the same type together e.g. attributes, functions, measures, member properties etc. |  | N/A | |||
Calculated Member | A calculated member is a reusable formula whose value is calculated using other member values (e.g. by using a mathematical or logical operation). The member is dynamically calculated at the time of use. Measures or dimensions can be used in the member's formula. Mathematical operators may be inserted using the calculator keypad dialog box. |  |
| Member | ||
Function | A function is a named calculation that uses input fields as arguments and returns a result. The result can be used in a custom formula, calculated member or other resources, or it can become an input to another function. Data Hub ships with a suite of ready-to-use system functions to assist with complex calculations (similar to Excel).
|  | Varies | |||
Named set | Named sets are user-defined groups of members or measures from the Dimension Tree that can be reused in multiple analyses and other resources. Named sets allow users to create groups of members that do not otherwise exist in the cube. Named sets may contain members from different dimensions. A Named Set will only appear on the Dimension Tree if the display folder property is specified for the Named Set. |  | Set |
Dimension Tree actions and functions
Name | Definition | Icon | |||
|---|---|---|---|---|---|
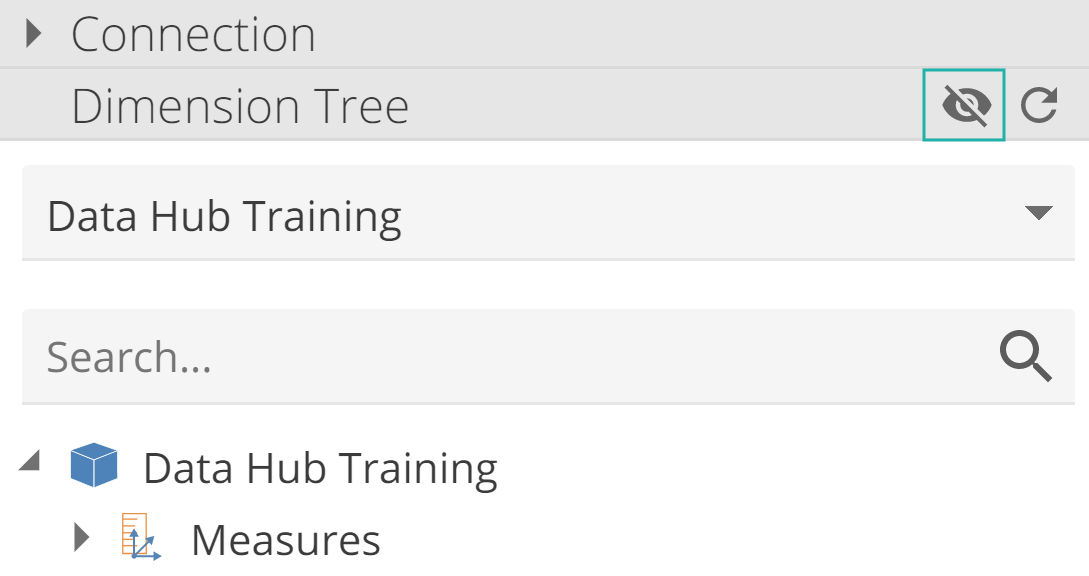
Filter | Filters the Dimension Tree to show only related dimensions for the measures currently on placeholders. |
|
| ||
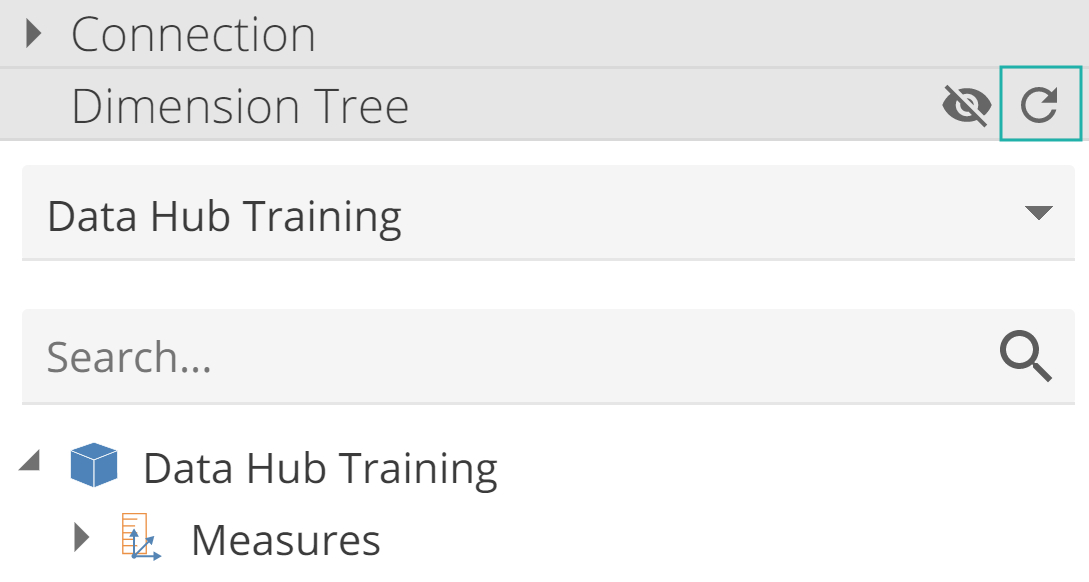
Refresh | Refreshes the Dimension Tree after changes |
|
| ||
Search | The Dimension Tree search function is shallow and will only search one level deep.
|
|
| ||
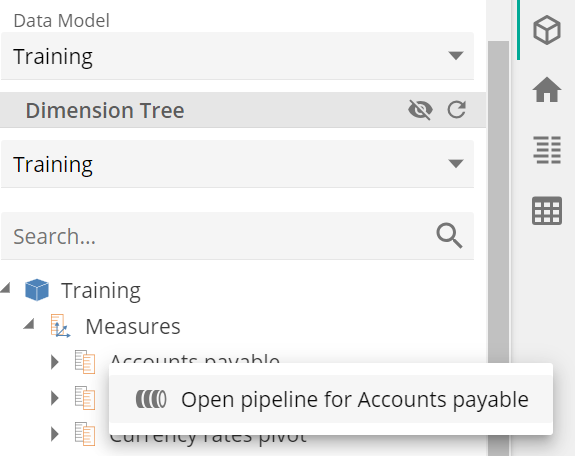
Right Click | A context menu becomes available on right click to enable navigation to the source of the cube elements inside the model
|
|


Placeholders
Various placeholders are available inside the design area with configuration options. Different placeholders have different context menus with functions and actions relevant to each respective placeholder.
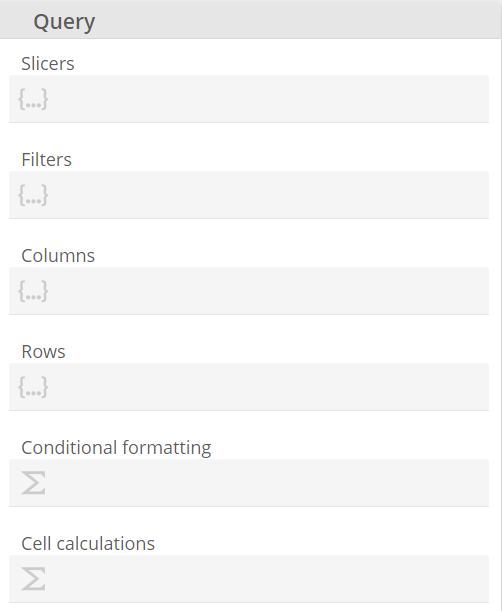 |
Conditional Formatting provides the ability to use several different functions to style subsets of data based on certain criteria, e.g. Only Sales lower than $1000 can be colored red while other sales stay the main color of the report.
Slicers are filter options displayed to the consumer to select at the report run time.
Filters are hard coded filters on the report level. They are only available at design time.
Columns/Rows are areas of a pivot table, or the axis of a chart report, where data elements can be placed.
Placeholder right-click menu
The placeholder right click menu gives users access to all relevant functions that can be used on the given placeholder type.
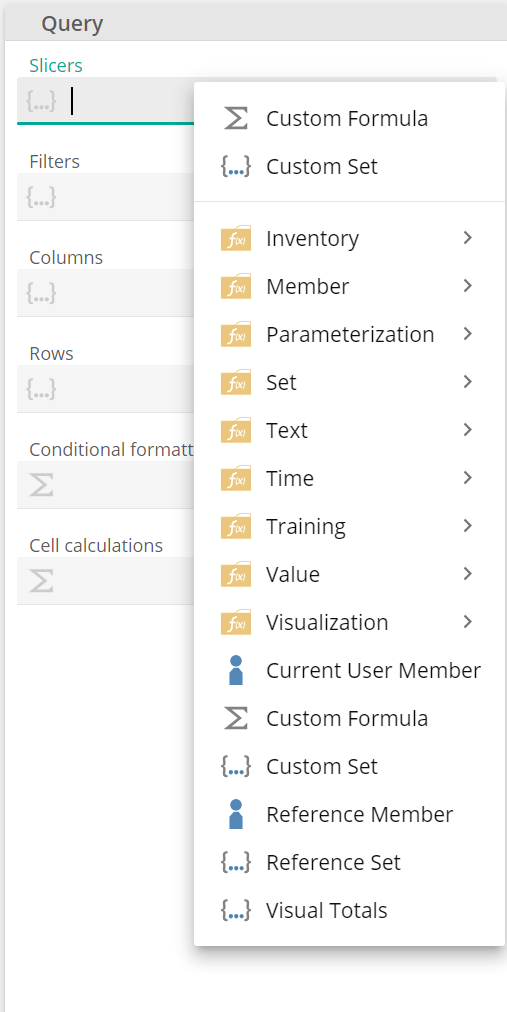
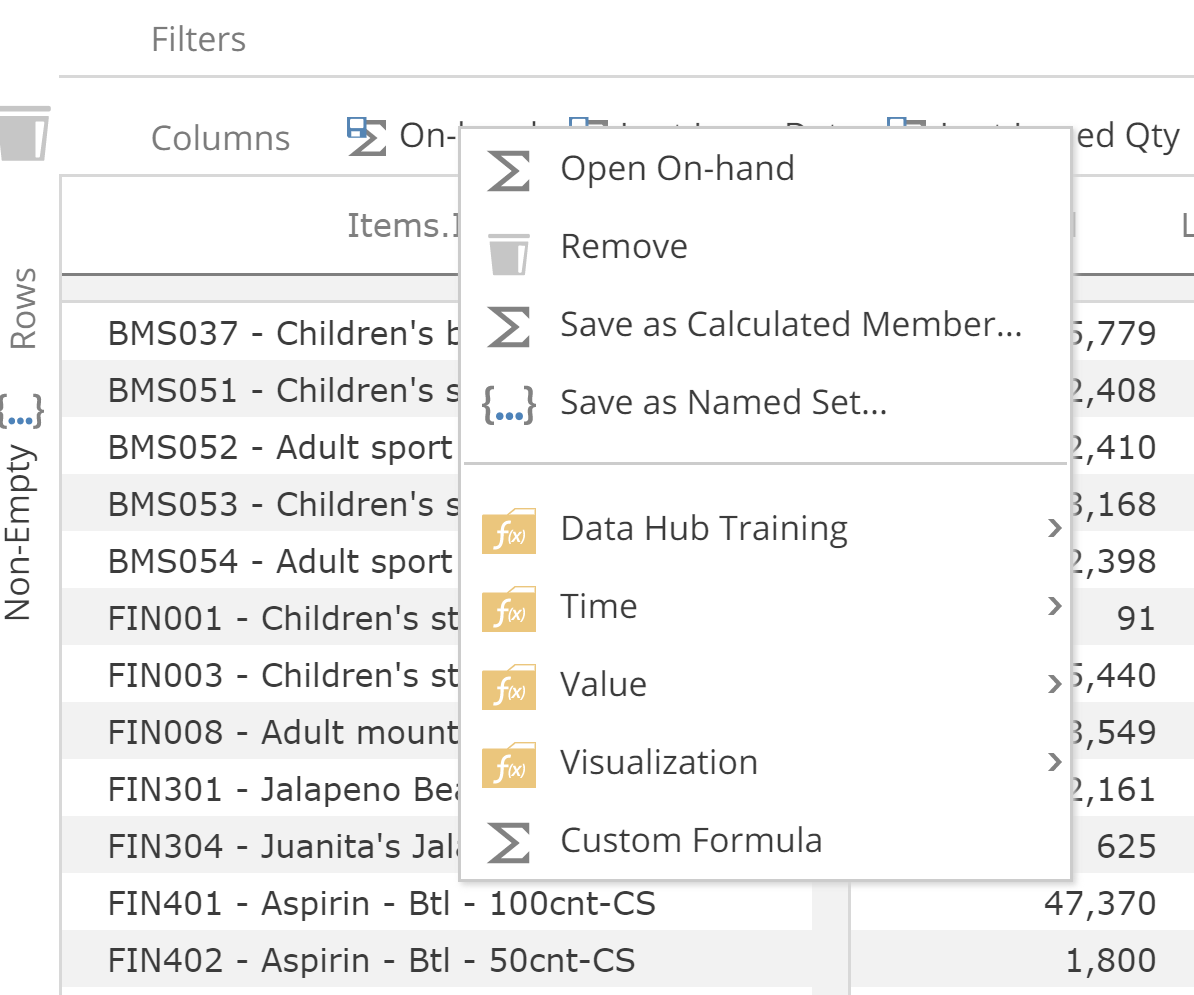
Placeholder Query Part right-click menu
The placeholder Query Part right-click menu gives users access to all functions that can be used on the given Query Part.
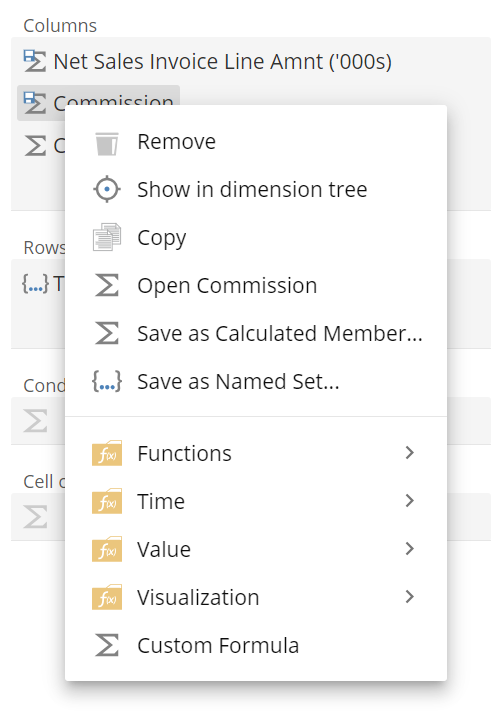
The Query Part right-click menu also provides some useful additional actions such as:
Remove - will remove the placeholder tab from the report.
Rename (on existing functions only). Once rename is clicked it will provide a text box to rename the placeholder tab.
Save as a Calculated Member or a Named Set
Show in dimension tree - only on query parts that have been saved on the dimension tree.
Wrap or Unwrap - provides the ability to group together some of the existing placeholders, for example British customers and Portuguese customers may be wrapped to be called European customers.
When you select tabs to wrap in a function, its placeholders are replaced by the new function placeholder. Although the analysis displays the same information as before, this can be helpful to keep the placeholder area organized when complex reports contain many different functions and items. Unwrapping will reverse the wrapping action.
Save as Calculated Member
You can save a member, measure or function as a calculated member, and replace the existing placeholder with the calculated member's placeholder.
Save as Named Set
You can save one or more members, measures or functions as a named set, and replace the placeholders with the named set's placeholder.
 |
Hierarchy groupings
Analysis tabs are grouped by Hierarchy. Data Hub will automatically group them to be in order no matter in which order they were added.
For Example, if 2019 from the Calendar hierarchy is dragged onto the placeholder of the column, followed by 2020 from the same Calendar hierarchy, Data Hub will automatically order them so items from the same hierarchy are together.
 |