Use analytic functions
Use simple analytic functions
Create a custom formula function
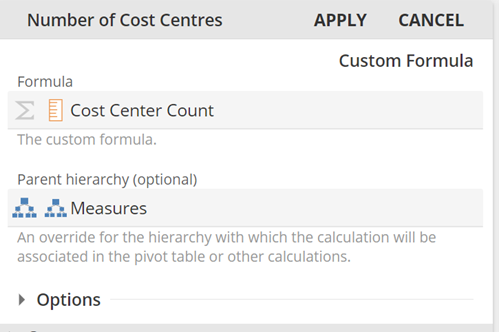
A custom formula is a formula that is created for use with a specific resource. A custom formula is a basic function used for simple calculations such as addition, subtraction, division, and multiplication. Custom formulas can only be used within the resource in which they are created.
Open Resource Explorer. Open Data Hub Training in Public.
Click on Sales > Performance. Select a resource.
Open the resource (e.g. sales report). On the Query panel, right-click the Rows or Columns placeholder. Choose the Custom Formula option.
Drag items from the Dimension Tree to the Formula placeholder.
Add operators and other symbols to the formula by right-clicking the Formula placeholder.
Add a Name by clicking in the top left.
Name - Give the custom formula a descriptive name. This name will appear on the Custom formula placeholder tab.
Description - Add a description of the custom formula. This information is visible when you hover over the custom formula.
Specify settings:
Parent hierarchy - Specify where in the Dimension Tree the custom formula will be placed.
Caption - use this to specify a dynamic caption that changes based on a specified member.
Drillthrough override set - Override the filtering members.
Calculation Order - Specify the calculation precedence of the formula.
Click Apply.
Edit an existing custom formula function
Click the custom formula placeholder tab on the Rows or Columns placeholder to open the Custom Formula design.
Add and remove items:
Add. Drag new entries from the DIMENSION TREE into a placeholder, then edit Formula or Parenthierarchy placeholders:
Items can be dragged from the Rows or Columns placeholders; however, they will exist both on the original placeholder and within the custom formula.
Remove by right-clicking items on the existing formula tab and select Remove
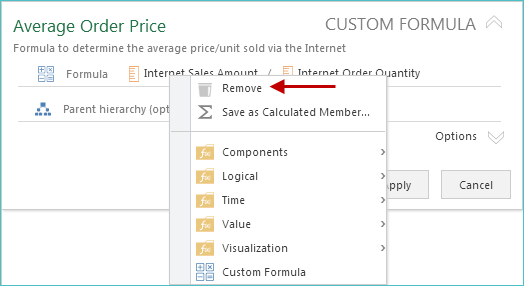
Change formula settings (e.g. formula operators, formula name, description, and calculation order).
Click Apply.
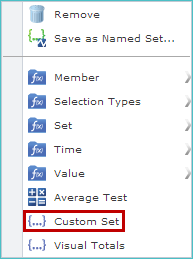
Create a custom set
Create custom sets by using the Custom Set function. Add items to the custom set by using the Custom Set dialog box using either of the following methods.
Method 1: Add items from the placeholders
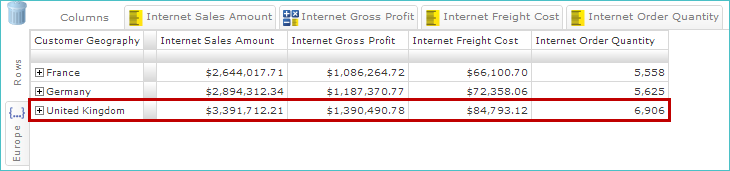
Select multiple items from the same placeholder using CTRL/Click.
Right-click one of the selected items.
Select Custom Set.
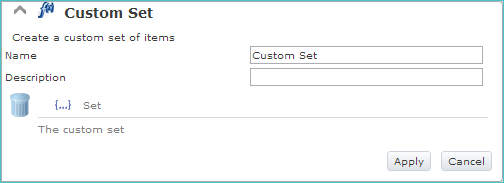
The Custom Set design appears with selected items in the Set placeholder.
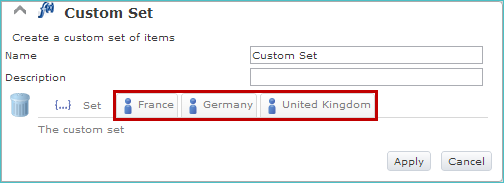
Name. Give the custom set a descriptive name.
Description. Include additional information regarding the custom set.
Click Apply.
Method 2: Add items via right-clicking the columns or rows placeholder
Right-click the placeholder that will contain the new custom set, and choose Custom Set.
Drag the items that you want to include in the custom set from the Dimension Tree to the Set placeholder.
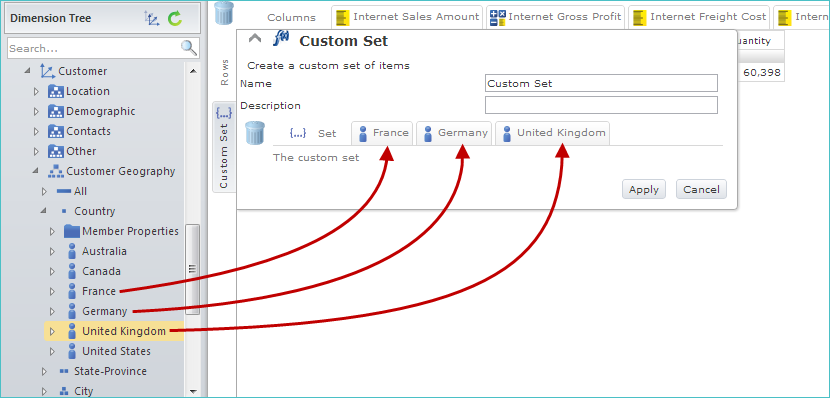
Add Name and Description.
Click Apply.
Add additional items to a custom set
Click the custom set placeholder tab to open the Custom Set design.
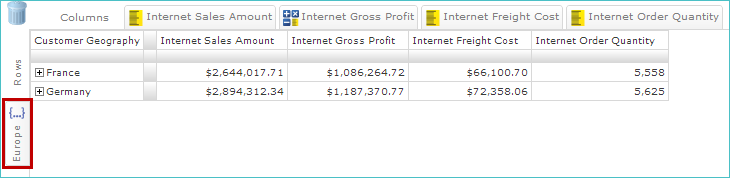
Drag items to the custom set from the DIMENSION TREE to the Set placeholder.
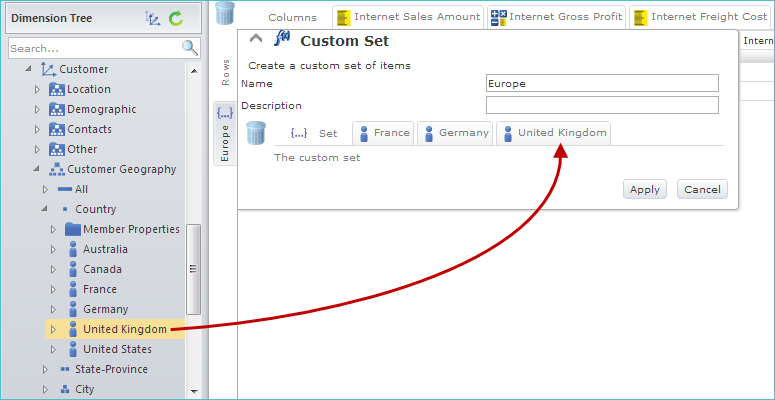
Click Apply.
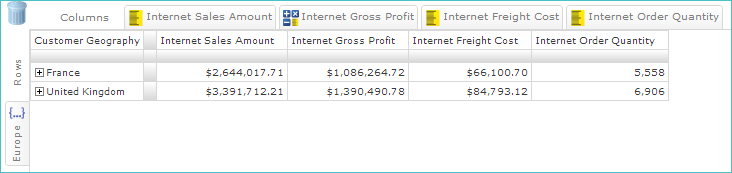
Remove items from a custom set
Click the custom set placeholder tab to open the Custom Set design.
Right-click the items you want to remove from the Set placeholder and choose Remove.
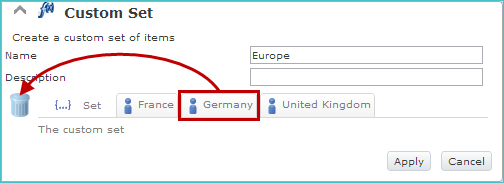
Click Apply.
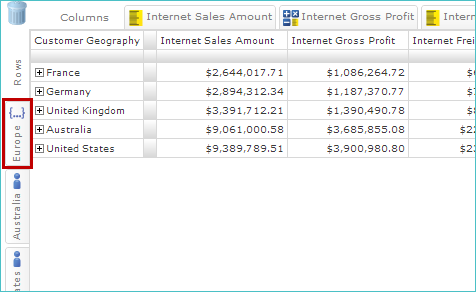
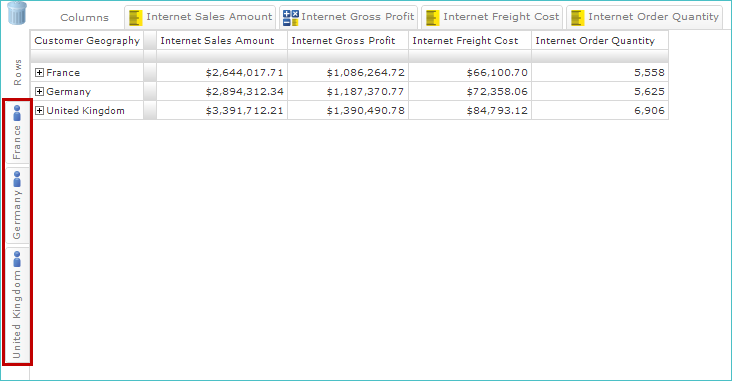
Unwrap a custom set
Locate the custom set you want to unwrap in the Row or Column placeholder.
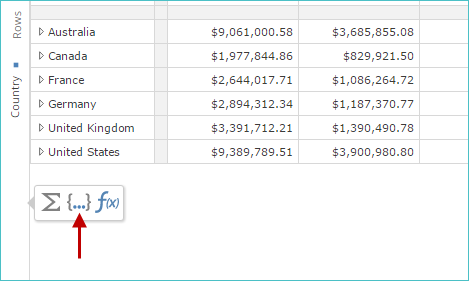
Right-click the Custom set placeholder tab and select Unwrap default field: Set from the menu. The custom set is removed and is replaced on the placeholder by its contents.
Nest an analytic function
There are three different methods for nesting functions:
Tip
These examples will show how to nest a sum function.
Method 1: Creating a nested function within a new function
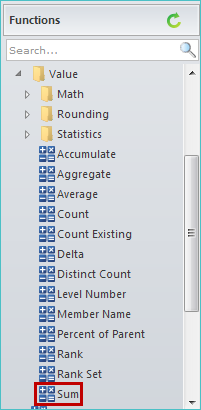
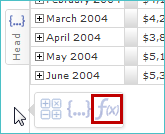
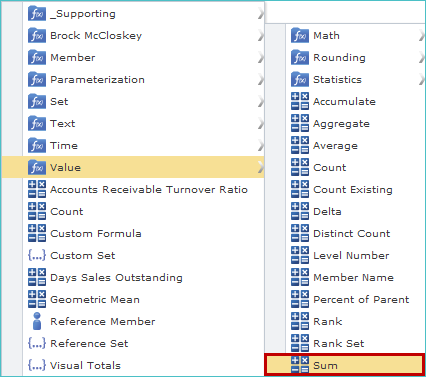
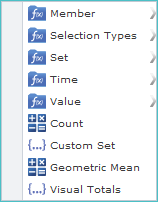
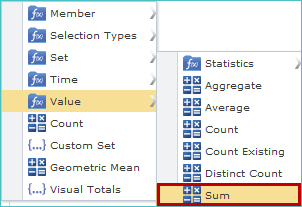
Click the Functions Explorer and locate the Sum function entry in the Value folder.
Drag the Sum function to the Rows placeholder.
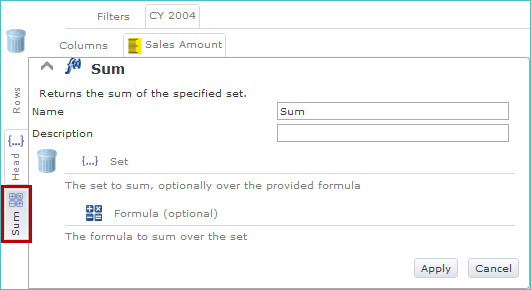
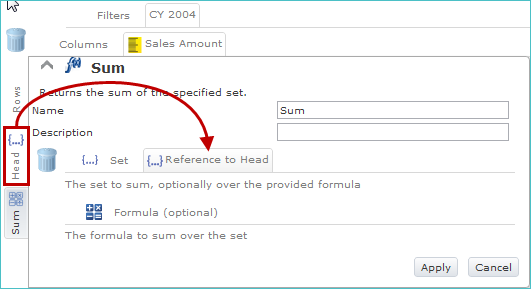
Right-click the Set placeholder in the Sum function dialog box.
Hover over the Set option and click Head.
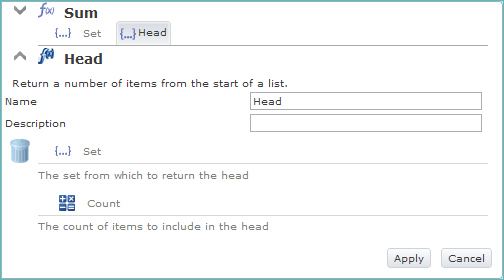
Define the Head function:
In the DIMENSION TREE, navigate to the following location:
Date dimension, Date.Calendar hierarchy.
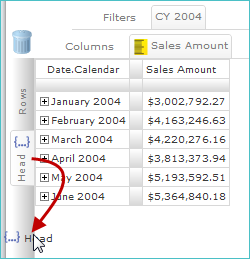
Drag the Month level to the Set placeholder in the Head function dialog box.
A Month tab appears on the placeholder.
On the Count placeholder, specify a placeholder number.
Click outside of the field or press the ENTER key on your keyboard.
Click Apply.
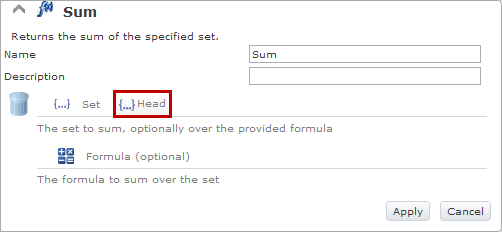
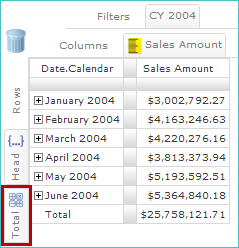
In the Name text box, type Total (replacing the default "Sum" text).
Click Apply.

Method 2: Create a nested function by referencing an existing function tab
Hover over the Row placeholder.
Click the Function.
Hover over Value and click Sum.
Click and drag the existing Head function to the Set field.
In the Name text box, type Total.
Click Apply.

Method 3: Create a nested function by right-dragging an existing function tab
Right-click and drag the existing Head function tab to an open area of the Rows placeholder.
Release the mouse button to reveal a menu showing all of the available functions.
Hover over Value and click Sum.
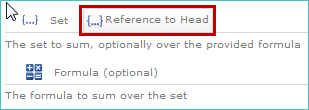
Click the Sum tab to reveal the function dialog box. The tab in the Sum function Set input field is labeled Reference to Head. Changes will be automatically reflected in the Sum function.
Type Total in the Name text box (replacing the default Sum text).
Click Apply.
By type
Use a numeric-type function (Sum)
The sum function returns the sum of the specified set.
Tip
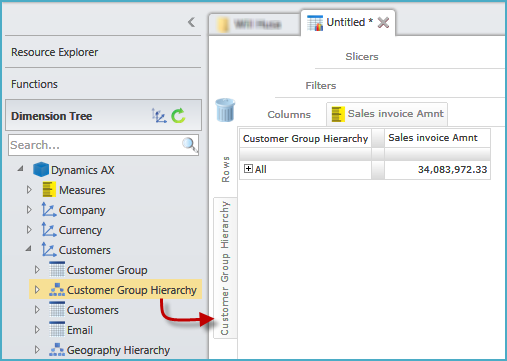
Example: The Sum function is used to find the sum of the total sales invoice amount for a Customer Group.
 |
Expand the Measures folder in the Dimension Tree.
Expand the Sales invoice measure group.
Drag the Sales invoice Amnt measure to the Columns placeholder. Sales invoice Amnt becomes a tab on the Columns placeholder.
Go to the Rows placeholder. Right-click on it to open up a pop-up menu.
Hover over Valuein the pop-up menu to display a submenu.
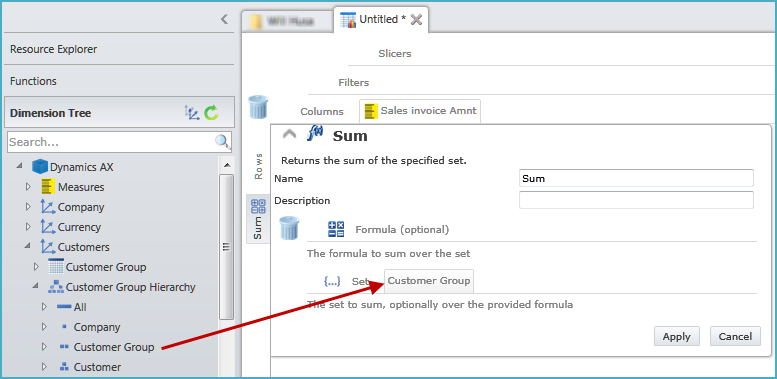
Click Sum from the submenu. Sum becomes a tab on the Rows placeholder and the Sum function pop-up box opens.
Collapse the Measures folder in the Dimension Tree to display the list of dimensions.
Expand the Customers dimension.
Expand the Customer Group Hierarchy.
Drag the Customer Group level to the Sumfunction pop-up box and drop it on the Set placeholder. Customer Group becomes a tab on the Set placeholder.
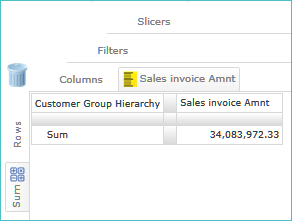
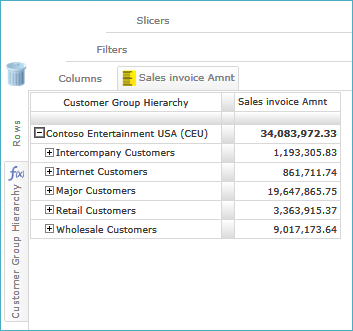
Click Apply .
The resulting analysis should show the Sum of the total sales invoice amount for Customer Group.
 |
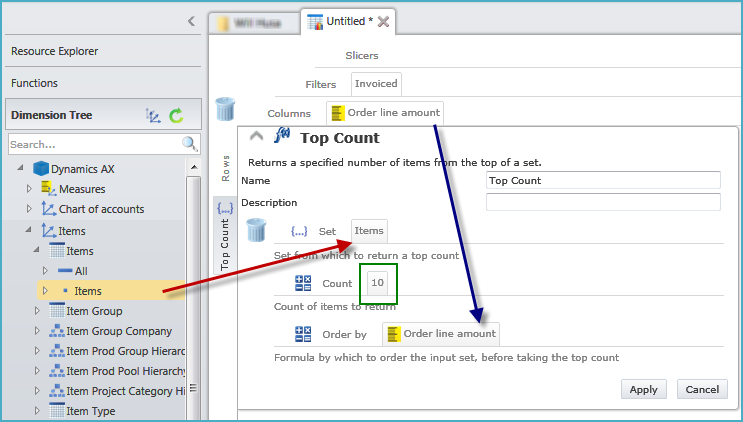
Use a set-type function (Top Count)
The set-type function returns a specified number of items from the top of a set.
Tip
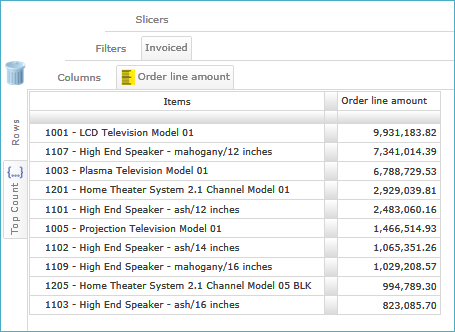
Example: Top Count function is used to find the top ten most sold items.
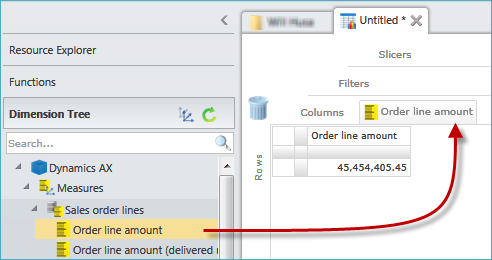 |
In the Dimension Tree, expand the Measures folder.
Expand the Sales order lines measure group.
Drag the Order line amount measure to the Columns placeholder. Order line amount becomes a tab on the Columns placeholder.
In the Dimension Tree, collapse the Measures folder.
Expand the Sales order lines dimension.
Expand the Sales Status attribute.
Expand the Sales Status level.
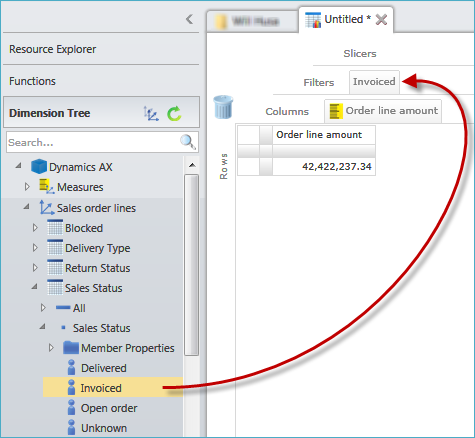
Drag the Invoiced member to the Filters placeholder. Invoiced becomes a tab on the Filters placeholder.
Go to the Rows placeholder. Right-click on it. A pop-up menu opens.
Hover over Set in the pop-up menu to display a submenu.
Hover over Top and Bottom on the submenu to display an additional submenu.
Click Top Count on the additional submenu. Top Count becomes a tab on the Rows placeholder. The TopCount function pop-up box opens.
Expand the Items dimension in the Dimension Tree.
Expand the Items attribute.
Drag the Items level to the Top Count function pop-up box and drop it in the Set placeholder. Items become a tab on the Set placeholder.
Drag the Order line amount tab from the Columns placeholder to the Top Count function pop-up box and drop it in the Formula to the order by the placeholder. Order line amount becomes a tab on the Order by the placeholder.
Click on the Count placeholder. An open value field displays.
Type 10 into the open value field and press the Enter key on your keyboard. The number 10 becomes a tab on the Count placeholder.
Click Apply .
The analysis should return the top ten most sold items.
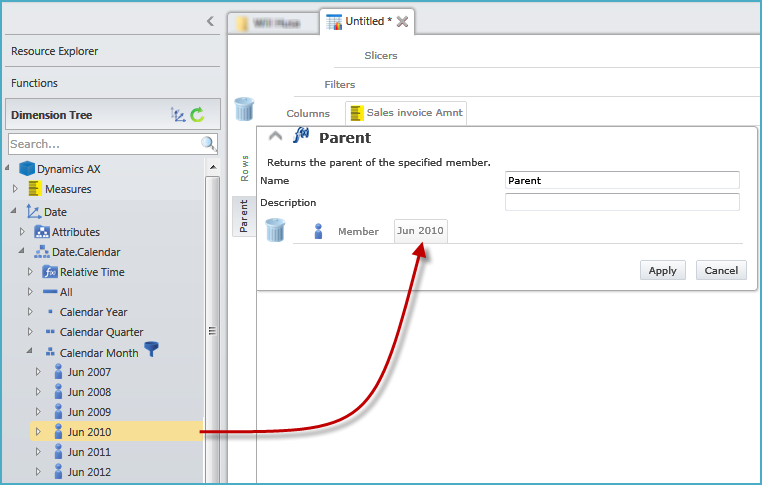
Use a member-type function (Parent)
The parent function returns the parent of the specified member.
Example: The parent function is used to find the total sales invoice amount for a specific quarter.
In the Dimension Tree, expand the Measures folder.
Expand the Sales invoice measure group.
Drag the Sales invoice Amnt measure to the Columns placeholder. Sales invoice Amnt becomes a tab on the Columns placeholder.
Go to the Rows placeholder. Right-click on it. A pop-up menu opens.
In the pop-up menu, hover over Member to reveal a submenu.
From the submenu, click Parent. Parent becomes a tab on the Rows placeholder. The Parent function pop-up box opens.
In the Dimension Tree, collapse the Measures folder. The list of dimensions displays.
Expand the Date dimension.
Expand the Date.Calendar hierarchy.
Expand the Calendar Month level.
Locate the Jun 2010 member. If needed, then use the Search feature provided in the level.
Drag the Jun 2010 member to the Parent function pop-up box. Drop it on the Member placeholder. Jun 2010 becomes a tab on the Member placeholder.
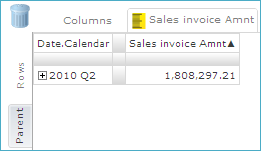
Click Apply .
The analysis should display two columns: Date.Calendar and Sales invoice Amnt. The table displays the sales invoice amount for the whole quarter of 2010. (The quarter for which June 2010 resides.)
Use a selection type function (Children)
This function returns the specified member's children.
Example: Use the children function to find the total sales invoice amount for all children in the customer group hierarchy.
In the Dimension Tree, expand the Measures folder.
Expand the Sales invoice measure group.
Drag the Sales invoice Amnt measure to the Columns placeholder. Sales invoice Amnt becomes a tab on the Columns placeholder.
In the Dimension Tree, collapse the Measures folder to display the list of dimensions.
Expand the Customers dimension.
Drag the Customer Group Hierarchy hierarchy to the Rows placeholder. Customer Group Hierarchy becomes a tab on the Rows placeholder.
Right-click on the Customer Group Hierarchy tab. Do not click on the Rows placeholder. A pop-up menu opens.
In the pop-up menu, hover over Selection Types to reveal a submenu.
Click Children.
The Customer Group Hierarchy tab becomes a function on the Rows placeholder. (As indicated by the function icon on the tab.)
The function pop-up box does not automatically open if the function parameters have been met.
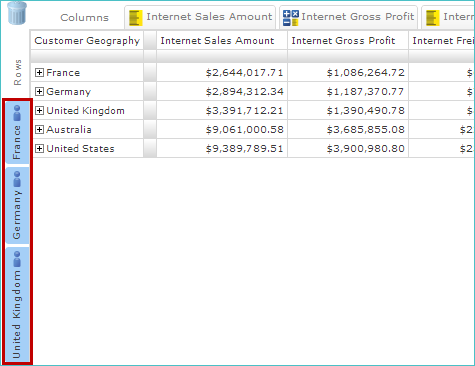
The resulting analysis should return a two-column table that displays the total sales invoice amount.
Click the plus sign to expand an entry to display its Children.
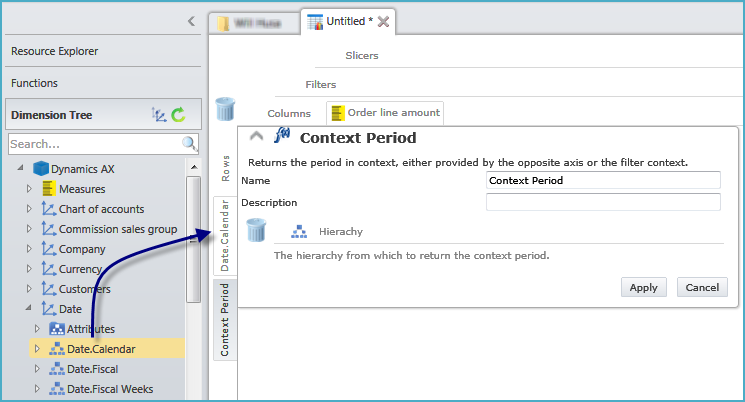
Use a relative time function (Context Period)
The context period function returns the period in context, either provided by the opposite axis or by the filter context.
Example: The context period function is used to total the Order line amount for all dates.
Expand the Measures folder in the Dimension Tree.
Expand the Sales Order lines measure group.
Drag the Order line amount measure to the Columns placeholder. Order line amount becomes a tab on the Columns placeholder.
Collapse the Measures folder in the Dimension Treeto display the list of dimensions.
Expand the Date dimension.
Drag the Date.Calendar hierarchy to the Rows placeholder. Date.Calendar becomes a tab on the Rows placeholder.
Right-click in the open space below the Date.Calendar tab to open a pop-up menu.
Hover over Time in the pop-up menu to display a submenu.
Hover over Current Period from the submenu to display an additional submenu.
Click Context Period from the additional submenu. Context Period becomes a tab on the Rows placeholder. The Context Period function pop-up box opens.
Do not drag items into the Context Period function pop-up box
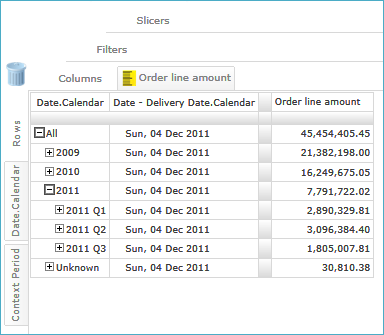
Click Apply.
The analysis should return three columns: An expandable calendar, the current delivery date and the total order line amount for all dates.
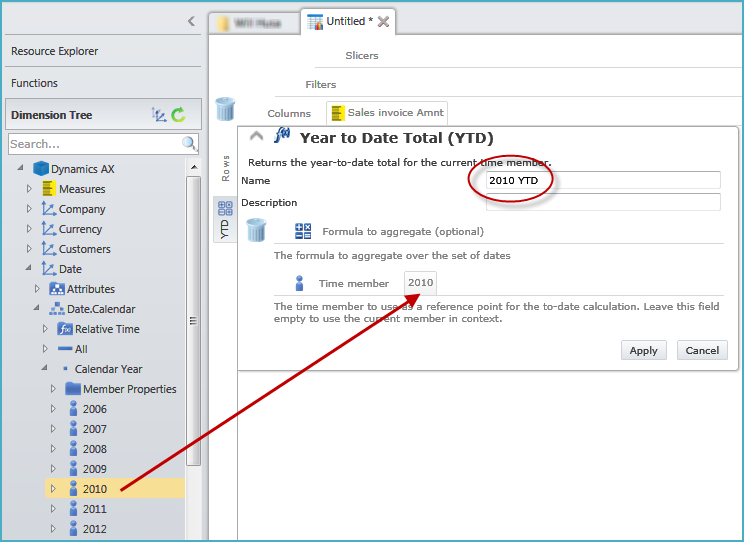
Use a relative time function (Year to Date)
The Year to Date Total (YTD) function returns the year-to-date total for the current time member.
Example: The Year to Date Total function is used to determine the total sales invoiced since a specified year.
Expand the Measures folder in the Dimension Tree.
Expand the Sales invoice measure group.
Drag the Sales invoice Amnt measure to the Columns placeholder. Sales invoice Amnt becomes a tab on the Columns placeholder.
Right-click the Rows placeholder to reveal a pop-up menu.
Hover over Timein the pop-up menu, to display a submenu.
Hover over Period to Date Totals from the submenu to display an additional submenu.
Click Year to Date Total (YTD) from the additional submenu. YTD becomes a tab on the Rows placeholder. The Year to Date Total (YTD) function pop-up box opens.
Collapse the Measures folder in the DimensionTree to display the list of dimensions.
Expand the Date dimension.
Expand the Date.Calendar hierarchy.
Expand the Calendar Year level.
Drag the 2010 member to the Year to Date Total (YTD) function pop-up box. Drop it on the Time Member placeholder. 2010 becomes a tab on the Time Member placeholder.
Click in the Name field. Clear the field and type in 2010 QTD.
Click the Apply button.
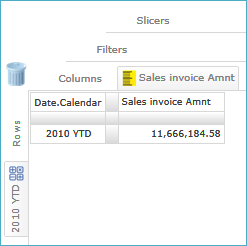
The YTD tab on the Rows placeholder is renamed to 2010 YTD.
The resulting analysis shows the total sales invoiced since the year 2010.
Use a logical function (Is Current Member)
This function returns the current member from a hierarchy.
Example: Current Member function is used to find total General Ledger (GL) Quantity of the All calendar months and show the GL quantity of the previous sixth calendar months.
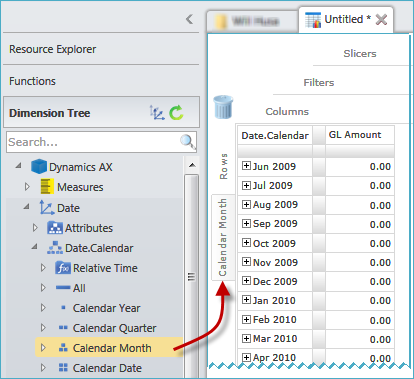
Expand the Date dimension in the Dimension Tree.
Expand the Date.Calendar hierarchy.
Drag the Calendar Month level to the Rows placeholder.
Expand the Measures folder in the DimensionTree.
Expand the General Ledger actuals measure group.
Drag the GL Quantity measure to the Columns placeholder. GL Quantity becomes a tab on the Columns placeholder.
Right-click in the open space to the right of the GL Quantity tab to open up a pop-up menu.
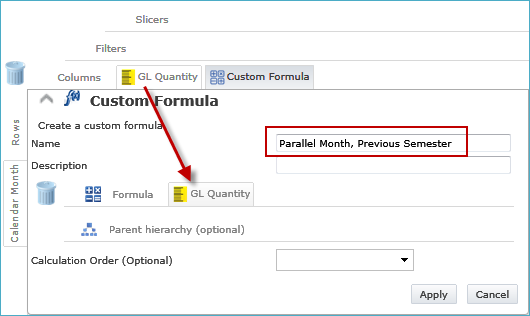
Click Custom Formula in the pop-up menu. Custom Formula becomes a tab on the Rows placeholder. The Custom Formula function pop-up box opens.
Drag the GL Quantity tab from the Columns placeholder to the Custom Formula function pop-up box and drop it in the Formula placeholder. GL Quantity becomes a tab on the Formula placeholder.
Clear the contents of the Name field. Type in Parallel Month, Previous Semester.
Right-click in the open space to the right of the GL Quantity tab on the Formula placeholder to open a pop-up menu.
Hover over Member in the pop-up menu to display a submenu.
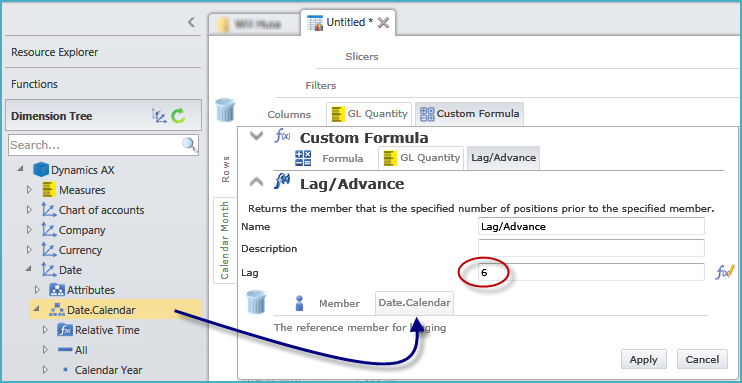
Click Lag/Advance from the submenu. Lag/Advance becomes the second tab on the Formula placeholder.
The Lag/Advance function area opens up within the Custom Formula function pop-up box.
Type in a value of 6 in the Lag field.
Collapse the Measures folder in the Dimension Tree to display the list of dimensions.
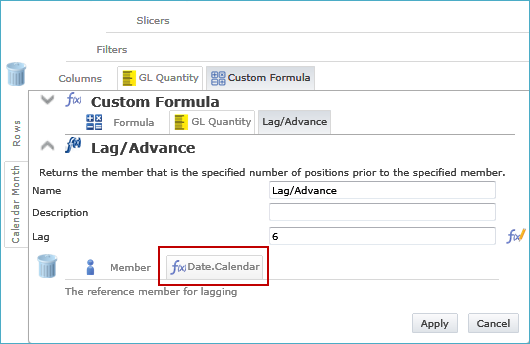
Drag the Date.Calendar hierarchy to the Lag/Advance function pop-up box and drop it on the Member placeholder. Date.Calendar becomes a tab on the Member placeholder.
Right-click on the Date.Calendar. Do not click on the Member placeholder. A pop-up menu opens.
Hover over Member in the pop-up menu to display a submenu.
Click Current Member from the submenu.
Date.Calendar becomes a function on the Member placeholder (as indicated by the function icon on the tab). The function pop-up box does not automatically open when the parameters for the function have been met.
The Lag/Advance function area collapses within the Custom Formula function pop-up box.
Click Apply.
Click Apply.
The Lag/Advance function area collapses within the Custom Formula function pop-up box.
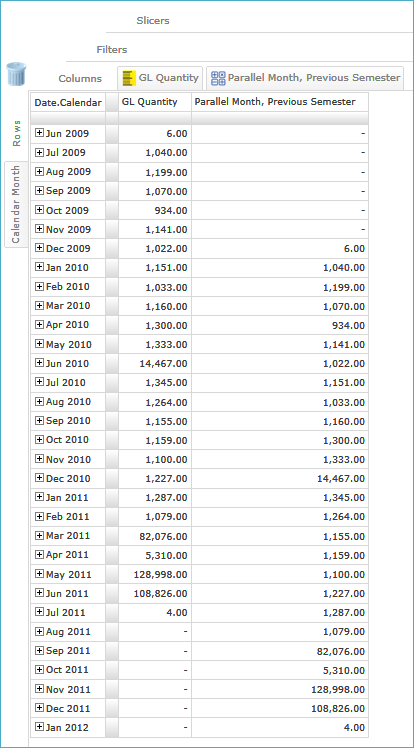
The analysis should display the total general ledger quantity of all calendar months in the system along with the parallel months of the previous semester.
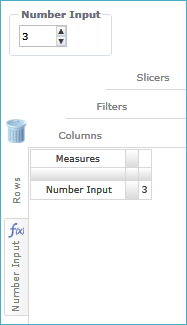
Number input parameterization
This function is a parameterized numeric entry that prompts the user with a text box when the resource is opened.
Example: Create an Input box to select numbers from three to ten, using the Number Input Function and with a three as the default selection.
Right-click on the Rows placeholder to open a pop-up menu.
Hover over Parameterization in the pop-up menu to display a submenu.
Click Number Input from the submenu, to create a Number Input function tab on the Rows placeholder.
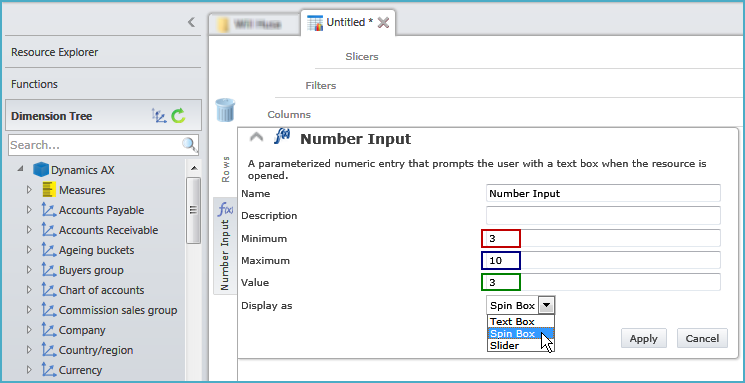
In the Number Input function pop-up box:
Click in the Minimum field. Enter a number minimum.
Click in the Maximum field. Enter a number maximum.
Click in the Value field. Enter a number that will be designated as the default value.
Click the down arrow in the Display as field.
From the drop-down menu, click Spin Box.
Click Apply.
The resulting analysis displays a Number Input spinner box with a default value.
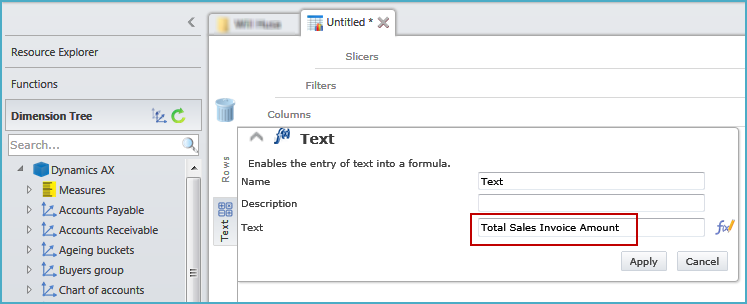
Use a text function (Member Name)
This function enables the entry of text into a formula.
Example: Find a specific measure using the Text function to enable a text value to be returned.
Right-click on the Rows placeholder to reveal a pop-up menu.
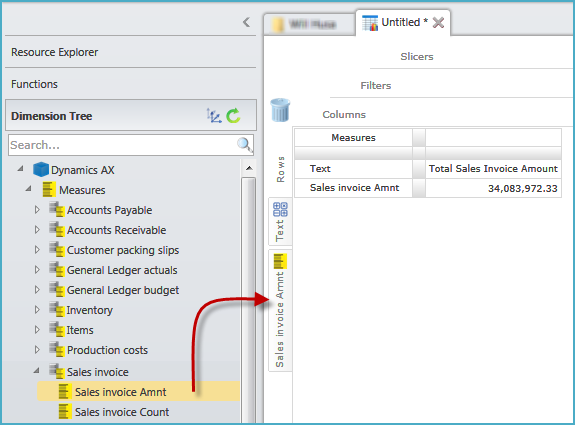
Hover over Text to display a submenu.
Click Text from the submenu to create a tab on the Rows placeholder.
Go to the Text field in the Text function pop-up box and type in the relevant text.
Click the Apply button.
The analysis displays a two-column heading row that features the relevant text.
Expand the Measures folder in the Dimension Tree and expand the required measure group.
Drag the applicable measure to the Rows placeholder. The measure becomes a tab on the Rows placeholder.