Analytic functions
Overview
Functions are calculations that use input fields to provide data to the function; the function’s result (the value it returns) may appear in one or more cells in an analysis or other resource, it can also be used in a custom formula, a calculated member or other resource, or it can be nested in (become an input to) another function.
Various items in your cube (such as measures, levels, and members) can be used to assign values to input fields. The function's result will be of a particular data type, depending on the function. It may be a value, set, member, or a Boolean expression.
Use functions to calculate values and perform operations based on selected dimensions members and measures (e.g. ordering), fetch values based on selected criteria and much more.
Configure functions via a dialog box that is accessed after the function is added to an analysis or other resource.Configure functions via a dialog box that is accessed after the function is added to an analysis or other resource.
System functions and solution functions
Input fields
Input fields (also referred to as arguments, inputs, or parameters) are items used within a function to provide the information required to calculate a result. Some input fields are optional but are always identified. A "top 5" function needs to be given criteria (e.g. sales) so it can calculate the top 5 sales.
In Data Hub, each input field in the function dialog box has the following interface elements:
A placeholder or another area where information is directly added to determine the function calculation.
A short description of the purpose of the information assigned to the input field (i.e. how the function uses the assigned information to complete its calculation).
Placeholder-type input fields only. An icon representing the data type of the input field.
Two main input actions for functions:
Drag cube elements into placeholder fields.
Direct or text input.
Example
In the following example, the Top Percent function is shown. The function uses placeholder fields and text box direct-input field. Items from the Dimension Tree are dragged into the placeholder fields, and free text is typed in the direct input text boxes.
The first placeholder input field (Member) takes a member data type.
The second placeholder input field (Ascendant Level) takes a level data type.
The text box input field (Lag) takes a number input, which is entered directly in the corresponding text box.
Using the information assigned via the input fields, the function, as defined below, will return the parallel member for one calendar year before the Apr 2012 member, that is, the Apr 2011 member.
Number key:
Text box-type direct input field requiring user input data type
Placeholder-type input field requiring member data type
Placeholder-type input field requiring level data type
Icons informing you of the data types expected by each input field
Input fields data types
Functions use input fields to return a result. Each input field and the function's result have a data type. Input field data types control cube elements that are used to assign values to a function's calculation. The data type of a function result controls how it displays in Data Hub and what can be done with it.
Several data types are available; however, three common data types for function input fields and results are:
Value - A numerical or text value (e.g. a measure).
Set - A collection of individual members (e.g. a level).
Member - An individual member from a level or attribute.
Cube elements
It is necessary to provide a cube element (or enter a direct input) of the correct data type for each input field.
Each cube element has a data type. For example: levels are sets; hierarchies, attributes, and dimensions are members; and measures, calculated members, and member properties are values.
Data Hub will automatically convert an argument from one type to another,usually. For example, a member dragged to a set placeholder is converted to a set with one member.
Note
Use the function tool tips to quickly check the data types of a function's input fields and result.
Some functions require data types that do not have icons. These data types are shown as text in square brackets.
Time context members input fields
Relative time functions require a time context. Without an explicit time context, relative time functions use the current date as the default context.
Sources of the relative time context:
A parameter within the function.
The opposite axis. (For Rows, the opposite axis would be Columns.)
A single member filter.
The End (Context) member of a slicer. (The End (Context) drop-down list includes all members from the slicer placeholder and defaults to the last. This member provides the current member context for all functions that do not have their time member set explicitly.)
Required and optional fields
Required. All functions have one or more input fields that must be assigned for the function to work.
Optional. Some functions have optional input fields, which may be assigned a value if desired but need not be filled in. If an optional field is not filled in, a default behavior occurs. The default behavior depends on the function and is explained in the function's dialog box or its help listing. Every optional input field is identified with the text "(optional)" after the field name.
Example
If you are using the Months to Current function, you can use the optional Count input field to indicate how many months to include.
A value of 6 directs the function to return a set of the last six months including the current month. If the Count input field is left blank, the Months to Current function returns a set containing all the months in the cube, up to and including the current month.
Note
Use the enhanced function tool tips to quickly check if a function has any optional input fields.
Function result data types
The execution of the function will return a result. In Data Hub, each function's result has a data type.
System function results use one of the following five data types:
Number. The function's result is a numeric value, either an integer or a decimal.
Set. The function's result is a set of members.
Member. The function's result is a single member.
Boolean. The function's result is either TRUE or FALSE.
[Tuple]. The function's result is a tuple (a cell or section in the cube).
Some functions, particularly custom functions, may return other data types.
Note
Use the symbols on FUNCTIONS Explorer, as well as the function tool tips, to quickly check the return types of functions.
Return types help you determine how a function can be used:
A function with a Boolean return type might be used as a true or false condition in other functions or calculated members.
A function with a Member or Set return type can be dragged directly onto analysis placeholders to display the member or set in the analysis.
A function with a Numeric return type might be used within a calculated member or custom formula, or it can be dragged directly onto an analysis placeholder to display its value in the analysis.
For example, if you are using the Sum function, the result data type is a number. In other words, the Sum function returns a single value which is the sum of all of the items in the specified set. The example below shows a Sum function that returns a number representing the total sales for the set of all customers.
Using analytic functions
Add analytic functions
The four techniques for adding functions are outlined below.
Hover Technique. When you place your mouse pointer over a placeholder and hold it there for a few seconds (hover), a menu appears. Clicking the Function button allows you to add a tab containing a function directly to the placeholder.
Right-click a Placeholder Technique. When you right-click a placeholder tab, a menu appears allowing you to apply a function to an existing placeholder tab. This is also known as "wrapping" the tab in a function.
Right-click and Drag Technique. When you right-click an existing placeholder tab and drag it to an empty area of a placeholder, a menu appears that allows you to make a copy of the existing placeholder tab and apply a function to the copy.
Direct Dragging Technique. When you drag a function directly from the Functions Explorer or Resource Explorer to a placeholder, you add a tab containing the function directly to the placeholder.
Nesting analytic functions
Nested functions are functions within functions (known as nesting) to help with simplifying complex calculations and logic that may require several steps.
This most outer function is referred to as the nesting function to distinguish it from the inner or nested function. Nested functions can be several levels deep.
The calculation order that is used when nesting various functions may influence the final functions' result. This is described in Calculation order.
Three different methods exist for nesting functions:
Method 1: Creating a Nested Function Within a New Function
The traditional method for creating a nested function is to create a nesting function that will hold the nested function, and then create the nested function on a placeholder within the nesting function's dialog box. This method creates a single, complex calculation, and is recommended if the nested function is only going to be used once or if only the result of the nesting function (and not the nested function) is to be displayed in the analysis.
Note
If you plan to nest the same function within more than one nesting function on the same analysis, or you require the result of the nested function to be displayed in addition to the result of the nesting function that uses it, it is more efficient to create the nested function as a separate, standalone function on a placeholder of the analysis and reference the nested function in one or more nesting functions instead.
Method 2: Creating a Nested Function By Referencing an Existing Function Tab
If a standalone version of the function to be nested is required in the analysis, regardless of its use in a nested function, you can create a "referenced" nested function. When this method is used, the standalone version of the function to be nested is configured first. Then, a reference to this function is nested within another function.
Note
This method is recommended if the nested function is going to be used inside multiple functions, or if you think the nested function's settings may be changed at some point. Since the nested function is referenced in the nesting function, changing the "standalone" version of the function automatically updates all references to the function, and allows you to avoid having to manually change each nesting function.
Method 3: Creating a Nested Function By Right-Dragging an Existing Function Tab
This method achieves the same result as Method 2, described above, in that you create a "referenced" nested function. However, this method can be considered a shortcut, since it allows for quicker creation of a nested function (with only a few mouse clicks). This technique is sometimes known as "wrapping" a tab in a function.
Note
This method is recommended if the nested function is going to be used inside multiple functions, or if you think the nested function's settings may be changed at some point. Since the nested function is referenced in the nesting function, changing the "standalone" version of the function automatically updates all references to the function, and allows you to avoid having to manually change each nesting function.
Unwrapping analytic functions
You can "unwrap" a configured function, replacing it with the items (tabs) on the function's default field placeholder.
Locate the function you want to unwrap.
Example
In the following example, a Head function is used. Notice that the function contains a single placeholder tab in its default (Set) field.
Right-click the function's placeholder tab.
Example
In the following example, the placeholder tab is located on the Rows placeholder.
Select Unwrap default field from the menu that appears, and notice that the function's default field (Set) is listed adjacent to the option.
The function is unwrapped, and the placeholder tab from its default field is now a standalone placeholder tab on the corresponding resource placeholder.
The Right-click drag and drop wrap method
This feature allows you to wrap the contents of any placeholder tab in a function.
Example
A tab on the slicer placeholder is used in this example.
In the following procedure, a placeholder tab is wrapped in a function, but the original tab (and its related contents in the drop-down list) remain easily accessible, since the right-click drag-and-drop method is used to duplicate the tab on the slicer placeholder.
Normally, when you wrap a slicer tab on the Slicers placeholder (by right-clicking the slicer tab and selecting a function from the menu that appears), the function you select replaces the original slicer tab.
You can wrap a copy of an existing slicer tab in a function, but also leave the original tab on the Slicers placeholder using this right-click method. As shown above, in this example there is a single slicer tab (Calendar Year). The contents of this slicer tab are displayed via a drop-down list, as shown below. The drop-down list can be made more useful by adding a Most Recent Period entry to the end of the list.
Right-click and drag the existing slicer tab to the right side of the Slicers placeholder.
Release your mouse button.
A menu appears, allowing you to select the wrapping function.
Select the function you want to use.
Once selected, the function appears on the Slicers placeholder, to the right of the original Calendar Year level.
Click the slicer's drop-down list to view its contents.
Notice that both the original options and a new option based on the selected function (Most Recent Period) are now available.
Analytic parameters
Notable functions
Custom formulas and custom sets
Custom sets
Custom sets have a similar function as named sets, but can only be used in the resource where it is created. When a custom set is saved, it becomes a named set that can be re-used across multiple resources.
Custom sets are also user defined groups of members or measures from the Dimension Tree. They are often useful to group together multiple members or measure, in order to clean up the design area. They can also be used to pair together items from different hierarchies, that don't otherwise exist.
Reference member and reference sets
Calculation order
The order that calculations are performed in an OLAP cube can lead to incorrect totals and other problems. These issues can be addressed by manually specifying the calculation order. Fortunately, most calculations do not require any changes to the calculation order.
The classic symptom of an incorrect calculation order in an analysis is a displayed column or row total of a custom formula or other calculation that doesn't agree with the correct total of the individual values. Similar issues may occur with averages and other aggregations.
The detail calculations themselves are correct – they just don't add up.
Problems can be fixed by explicitly specifying the calculation order for the detail calculations.
In Data Hub, calculation precedence can be made explicit in the definition of a function, custom formula or calculated member, using the Calculation Order combo box.
The following possibilities are available as drop-down values:
Pre-Aggregation. Calculation takes place before members are aggregated (e.g. a currency conversion involving a multiplication).
Aggregation. Calculation itself performs aggregation and is therefore a reference point for the other pre- and post-aggregation calculations. Simple formulas using non-precedence operators can use this type. For example, values might be aggregated using a Sum template, or members might be added together in a custom formula (e.g. X + Y + Z).
Post-Aggregation. Calculation takes place after members have been aggregated (e.g. ratios involving division).
Blank. If the drop-down box is blank (the default), the behavior is the same as the Post-Aggregation setting, above. This means that calculations involving division will total or average correctly; calculations involving multiplication may need to be changed to Pre-Aggregation for totaling or averaging to work correctly. To return the drop-down box to the blank setting, simply select the text or number within it and press DELETE or BACKSPACE.
Note
If finer control of calculation order is needed, a numbered calculation order value can be manually entered in the combo box. Calculations are executed in ascending order as specified by the calculation order assigned to each one. Note that the three pre-defined orders are:
1000 = Pre-Aggregation
2000 = Aggregation
3000 = Post-Aggregation
Example
A calculation assigned a calculation order value of 1500 will be executed after calculations assigned to Pre-Aggregation (1000) and before calculations assigned to Aggregation (2000).
Complex calculations may sometimes result in anomalous results due to calculation order issues. In these cases, contact support for assistance.
Example 1 - Basic Subtotal
The following report uses two custom formulas with (quantity)+1; one formula uses pre-aggregation, the other uses post-aggregation. The different totals reflect whether the total is calculated before or after its constituents are calculated and aggregated.
The pre-aggregation formula adds one to each of the six countries' values before adding them up, hence its value is 27,665 – 6 larger than the unaltered value (27,659).
In contrast, the post-aggregation formula adds up the country values, then adds 1 to the total, so its value of 27,660 is only 1 larger than the unaltered value (27,659).
Example 2 - Total Sales
In a report on total sales, items A, B, and C are aggregated and a function provides an Amount formula for each item: price * quantity.
Importantly, the Amount function must be evaluated for each item before they are aggregated into the total:
(A_price*quantity) + (B_price*quantity) + (C_price*quantity)
More precisely, the following precedence order (post-aggregation) must be avoided:
(sum of all quantities)*(sum of all prices)
The following table provides sales totals using correct and incorrect precedence.
Item | Quantity | Price | Total Sales | ||
A | 3 | $2.00 | $ 6.00 | ||
B | 4 | $1.00 | $ 4.00 | ||
C | 5 | $3.00 | $15.00 |
Measure Totals 12 $6.00
Grand Total Sales with correct precedence (pre-aggregation) $25.00 (6+4+15)
Grand Total Sales with incorrect precedence (post-aggregation) $72.00 (12 * 6)
To ensure the correct results, the customer function definition should be set to be 'Pre-Aggregation', which means that the function will be executed against its members before the members are then aggregated in the report.
Example 3 - Average Cost Per Item
The following table shows how to calculate the average cost per item. Because division is used in the calculation, this example requires the opposite treatment to the above table. This time, the correct precedence is post-aggregation: the sales and quantities sold are totaled, then the sales are divided by the quantity to find the average cost per item for all three items taken together.
On each line, the Cost per item is calculated as: Total Sales / Quantity Sold.
The post-aggregation precedence order is needed this time:
(sum of all Sales Amounts)/(sum of all Quantities Sold)
The pre-aggregation order gives the wrong answer:
(A_sales/quantity) + (B_sales/quantity) + (C_sales/quantity)
Item | Sales | Quantity sold | Cost per item |
A | $6.00 | 3 | $ 2.00 |
B | $4.00 | 4 | $ 1.00 |
C | $15.00 | 6 | $ 2.50 |
Measure Totals $25.00 13
Average cost per item with incorrect precedence (pre-aggregation) $5.50 (2+1+2.5)
Average cost per item with correct precedence (post-aggregation) $1.92 (25 / 13)
Analytic function options
Drillthrough override sets
Creating a detail report as a result of the drill through action on individual cells of an Analysis Report produces a list of the constituent records used to create the cell values.
The Drill through override set placeholder is used to define a custom filter to be used when a Drill through is performed, instead of an automatically-generated set
There are circumstances where a Drill through cannot be produced automatically by Data Hub, because the constituent records cannot be unambiguously determined. In these situations, when a user attempts to create a Drill through on a calculated cell, Data Hub will return the following error message:
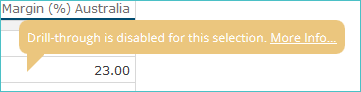
Drill through is disabled for this selection.
When this error occurs, the Drill through override set can be used to define a custom filter for Drill through Resources created for this function.
Add a drill through override set to a function:
This procedure works for any function that provides the drillthrough override option.
Within the function, click Options to access the Drillthrough override set placeholder.
Add elements to be used as filters for Drill through Resources from the Dimension Tree.
Once the Drillthrough override set has been defined, click Apply to add the Drillthrough override to the function.
How Data Hub handles functions when a drillthrough is performed:
This is an example analysis of the TransactionHistory measure group
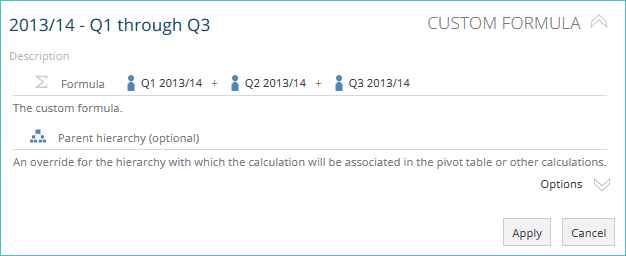
The Custom Formula being applied is Quarter 1 plus Quarter 2 plus Quarter 3 or the Year 2012/2014.
When a drillthrough report is created from the Custom Formula field, the members in the Custom Formula are added to the Filters placeholder as a set, similar to the example below.
Where operators other than addition are used in a function, drillthroughs are disabled.
Where Data Hub requires a drillthrough override set
This is an example analysis of the TransactionHistory measure group.
Within the function, click Options to access the Drillthrough override set placeholder.
Add elements to be used as filters for Drill through Resources from the Dimension Tree.
Once the Drillthrough override set has been defined, click Apply to add the Drillthrough override to the function.
Example
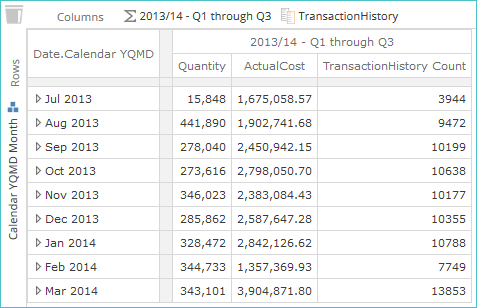
Transaction history measure group
The Custom Formula being applied is Quarter 1 plus Quarter 2 plus Quarter 3 of the Year 2013/14.
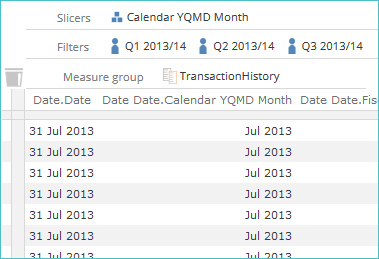
When a Drill through Report is created from the Custom Formula field, the members in the Custom Formula are added to the Filters placeholder as a set.
The Custom Formula being applied is Quarter 2 minus Quarter 1 of the Year 2013/14 (herein abbreviated to Q2 - Q1).
Due to the use of subtraction in the custom formula, the error "Drill through is disabled for this selection. More Info..." is shown when a Drill through is attempted.
The target function cannot be converted to a filter where two or more solutions exist and the Drill through is blocked. In this instance, there are multiple possible combinations that the user may be looking for when creating a Drill through on Q2 - Q1. The intended filter could be:
Q1 and Q2
Q1 only
Q2 only
The Drill through override set can be used to define the set of members to use as a filter when a drill-though is performed.
Q2 onlyWhen a Drill through Report is created from the Custom Formula field, the members in the Drill through override set are added as a set to the Filters placeholder.
Note
If you want to customize the columns displayed in a drill-through, create a custom Drill through resource and add it to the analysis's Drill through target resources placeholder. The set is used to filter the rows that appear in the Drill through report (in conjunction with any filtering on the Rows, Columns, Filters, and Slicers placeholders on the resource). The columns in the Drill through are generated automatically based on the measure groups used in the source analysis.
The Drill through override set placeholder does not accept: measures, functions that return a number, or calculated members.
The Drill through override set placeholder does not accept the Current Member function applied to a hierarchy. For date hierarchies, a similar result may be obtained by using the Context Period function.