Filters and slicers
Overview
Filters provide report designers the ability to filter an analysis during the design process so that it only displays partial sets of data. This setting cannot be changed by consumers.
Adding Slicers to an analysis provides the ability to consumers to filter report data dynamically when they are using the report.
Filters
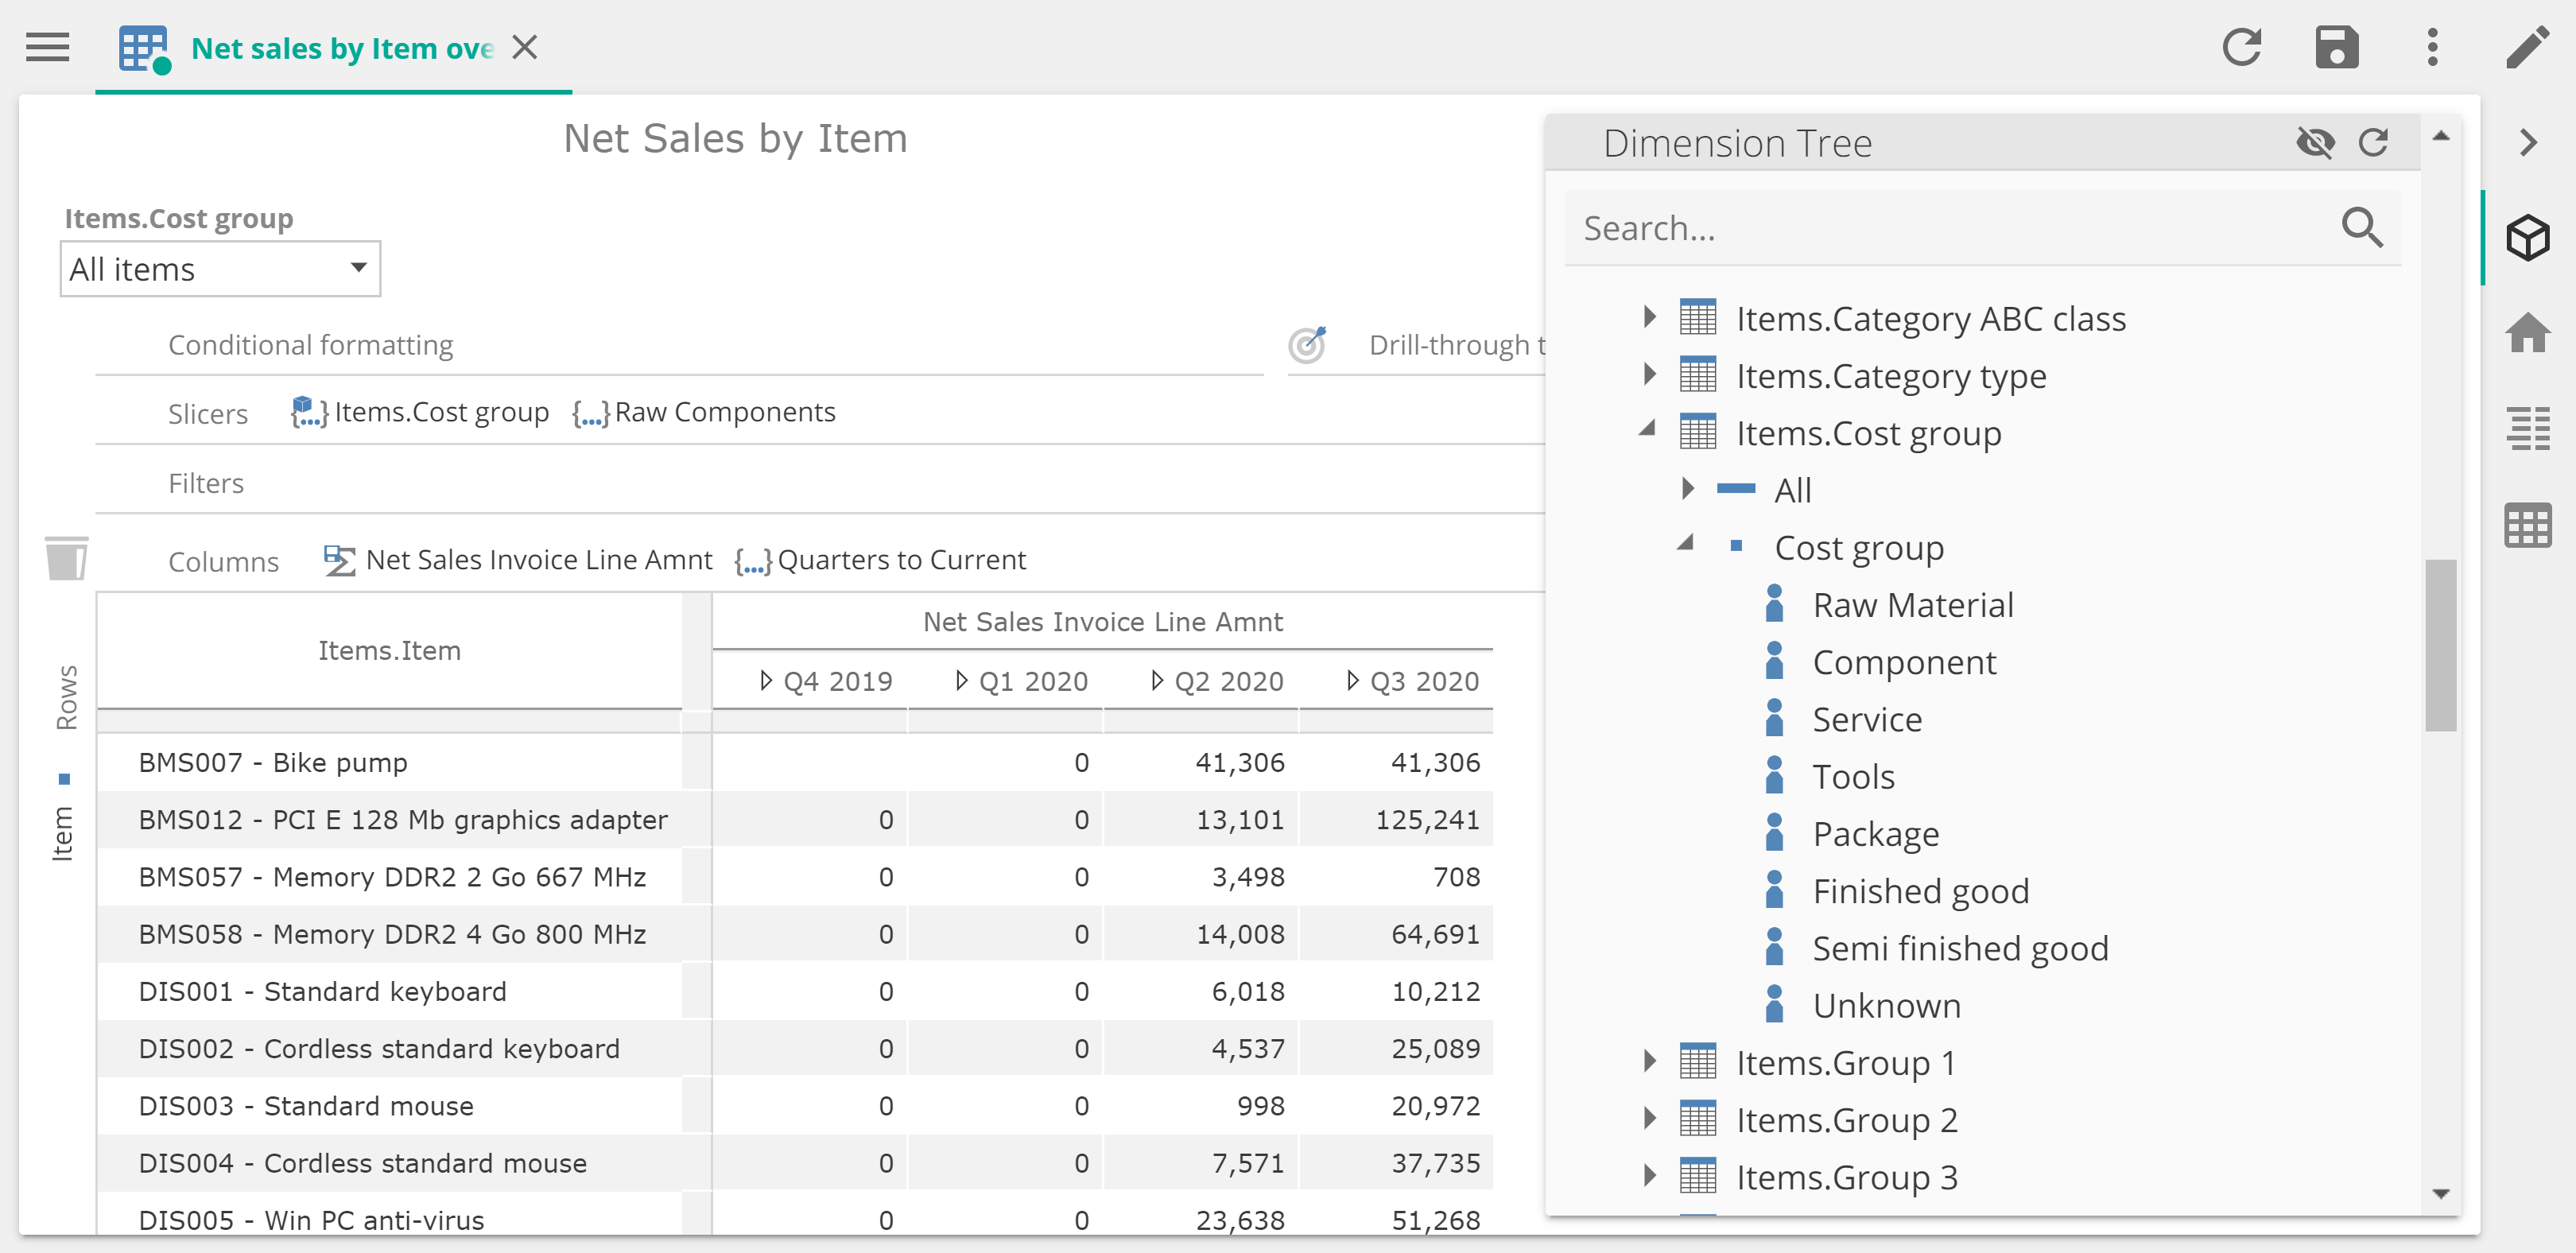
Items like levels, members and/or functions are dragged from the Dimension Tree to the Filters placeholder. Once the item is on the placeholder, the report is refreshed to show the filtered data.
Multiple filters can be added at once. You are also able to drag more than one item from the Dimension Tree onto the filters placeholder. Example you may want only certain product categories to show in your report. Using CTRL-click makes this possible.
Slicers
Consumer users can change slicer values, however, filters can only be added, viewed, and altered by designer users.
If more than one slicer is added, these slicers are known as cascading slicers, because each slicer filters the data before passing it on to the next one. Cascading slicer values are filtered from left to right. For more information, see Cascading slicers.
If a resource is saved with member(s) selected in a slicer, that selection will be reflected for all users when the resource is next loaded. For Single-select list or Date range slicer types dynamic selections, for example Current Year, are possible making use of member functions. More information can be found in Dynamic selections You can create hierarchical slicers, where members from multiple levels within a hierarchy can be accessed inside of slicer selection areas. For more information, see Using Hierarchical Slicers.
When working with Multi-select hierarchical slicers, formatted check boxes known as four-state check boxes, are used to indicate whether or not all the descendant members of a parent member are checked, and whether new cube items that appear as descendants of the parent member are automatically included in slicers when a cube is processed. More information can be found in Slicer four-state checkboxes.
Filters and slicers obey a series of rules of precedence to determine which filter elements are used to filter the data. For detail on the rules, and some practical tips for using filters and slicers effectively, see the Understanding slicer and filter precedence.
Note
If the All Items option is selected in a slicer, all the members available to the slicer are returned, regardless of the specified slicer limit (default value of 500). The All Items selection does not necessarily include all the members from the hierarchy or level that the slicer is based on. Any of the following settings will affect what a given slicer displays:
A cascading slicer to the left of the current slicer.
A filter in the resource’s Filters placeholder.
Filters and slicers applied to the containing resource(s).
You can control the title of a slicer containing multiple tabs by adding the tabs to a custom set on the Slicers placeholder, rather than directly to the placeholder. Below, the first slicer is a group of items that were added from the Items.
Cost group level, which inherits the level name as the title. The second slicer are the same group of items, but they were placed in a named set and the named set were given a custom title.
Slicer Settings
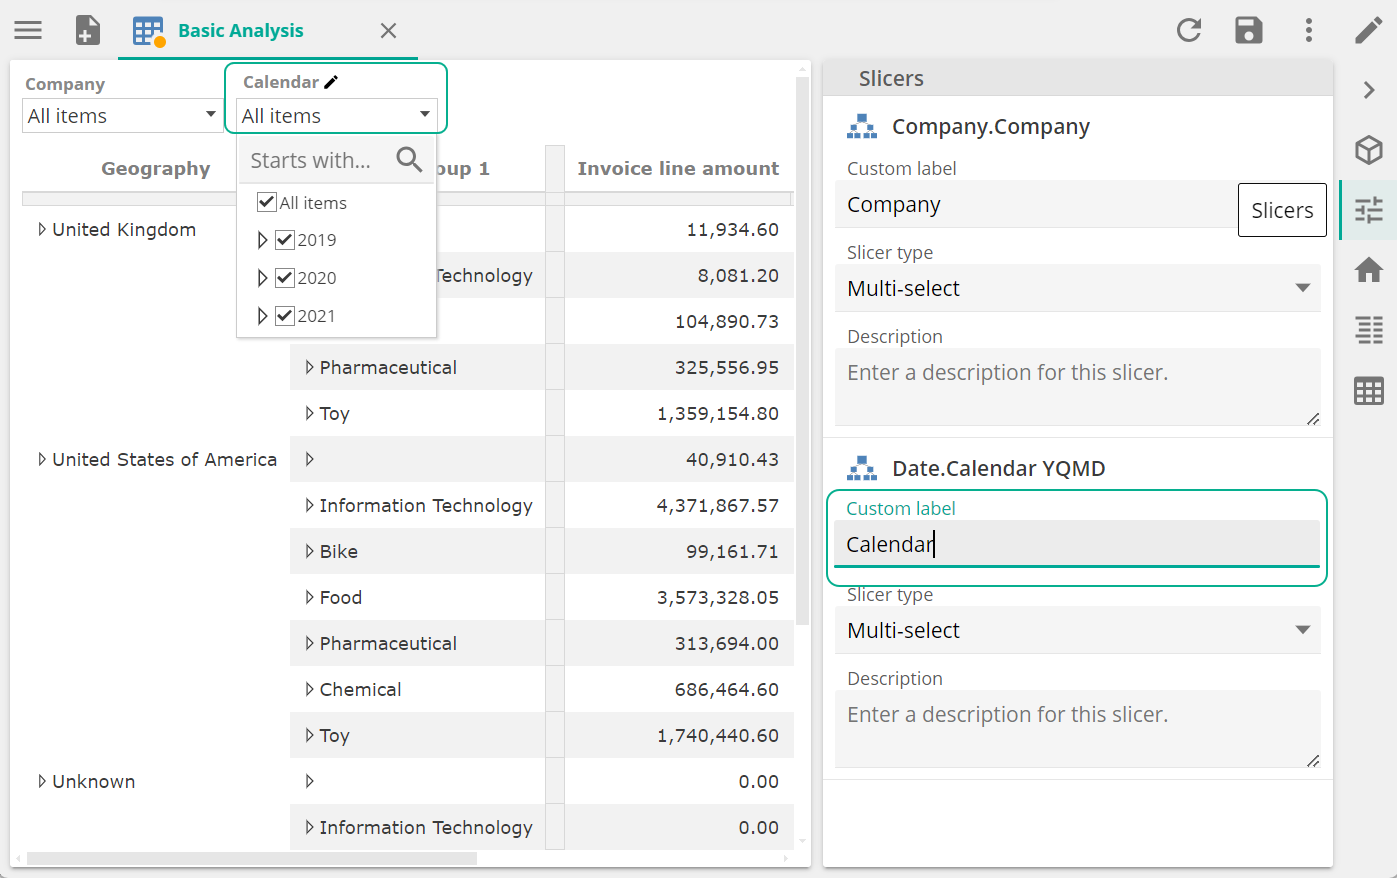
Slicer settings can be configured in the Slicer design panel. Label, Slicer Type and Description can be changed.
When being edited an edit icon will show next to the respective slicer on the analysis.
 |
Slicer types
Inline. The Inline list slicer type displays all choices as an array of check boxes at the top of the resource's tab.
Single select. The Single-select list slicer type displays all choices using an expandable drop-down list. While it uses less screen space than the Inline list slicer type, it allows only one choice to be made at a time.
Note
This type is selected, by default, when a new "date" slicer is created. For "date" slicers the user selection is provided as the Context Time Member for all time functions.
Multi-select. The Multi-select list slicer type combines the Inline list and Single-select list types by using a drop-down list that also contains check boxes, allowing you to choose more than one item.
The Check boxes in this selection type has two display element:
Checked state. Indicates whether the current items are selected or not, and whether new cube items will have the same state.
Border state. Indicates the status of the descendants.
Note
This type is selected, by default, when a new non-date slicer is created.
Date range. The Date range slicer displays as two drop-down lists, allowing you to choose a start date and an end date.
Note
The end date user selection is provided as the Context Time Member for all time functions.
Time context slicer. The Time context slicer allows you to specify a context period from a single drop-down list. The user selection is provided as the Context Time Member for all time functions.
Cascading slicers
Available values in multiple slicers cascade (filter each other) from left to right. That is, a value selected in the left-most slicer limits values in subsequent slicers to those with available data.
Cascading slicers generally work intuitively. On occasion, it may be necessary to understand their precise operation, which is explained below.
Cascading can be understood as applying a Remove Empty Rows filter to the set returned by each slicer before it is passed to the next slicer. To decide if a row is empty, one or more measures are examined to see if they are empty (null).
If no measure is present in the analysis or other resource, the slicer examines all the measures in the cube's default measure group.
If one or more measures are present in the analysis or other resource, the slicer creates a list of the measure groups that the measures come from, then examines all the measures in every measure group in the list. Note that dashboard slicers will examine every measure in every measure group in every resource in the dashboard.
For example, an analysis that displays sales of products by customer might have two cascading slicers: Product Name and Month. If Bicycles is chosen in the Product Name slicer, the Month slicer might not display January 2012 in its list because there were no sales of bicycles during this month (in other words, the Remove Empty Rows test found that all measures in the Sales measure group for Bicycles were empty for January 2012).
However, if a new measure, Units Produced, is added to the analysis, January 2012 might now be displayed in the Month slicer's list because some bicycles were produced in January 2012, although none were sold (in other words, the Remove Empty Rows test found that at least one measure in the Units Produced measure group for Bicycles was not empty for January 2012).
The same behavior is seen if the same two cascading slicers, Product Name and Month, are added to the Dashboard Slicers placeholder in a dashboard that contains an analysis with the Sales measure and a second analysis with the Units Produced measure.
Hierarchical slicers
Members from multiple levels within a hierarchy can be accessed in drop-down slicers. Members in the different levels are accessed using triangle icons to expand and collapse the levels. This multi-level drop-down is known as a hierarchical slicer.
Hierarchical slicers are created automatically based on the initial query which created the original slicer (as described in Slicing with the Dimension Tree). The initial query needs only to return members at one level, as lower levels can be accessed by expanding members to show their children, as needed. Once the slicer is created, you are immediately allowed to drill down on each member displayed by this initial query.
In the following example, a slicer has been created based on the Calendar Year level from the Calendar hierarchy. Notice that all members within that hierarchy (semesters, quarters, months etc) are immediately available for drill down.
Note
You can alter this automatic behavior and limit what is displayed within a slicer's hierarchy.
Note
You can alter this automatic behavior and limit what is displayed within a slicer's hierarchy.
To prevent performance problems if a slicer is configured to display a very large number of members, a slicer limit of 500 is enforced by default.
You can control what is displayed in the hierarchical slicer, limiting the default behavior of allowing access to everything in the slicer's hierarchy. This type of control is useful if you wish to limit the information displayed in the slicer.
Hierarchy terminology
Parent member. A member that has subordinate members. Year would be a typical parent member of months members
Child member. A subordinate member. Months members would be children of years.
Grandchild member. A member that is two levels below a parent member. Week members would be grand children of years, or in a hierarchy with Years, quarters, months and weeks, months would be the grand children of years.
Descendant member. A member that is subordinate to a parent member, regardless of how many levels it falls below the parent. In a calendar hierarchy, quarters, terms, months, weeks, days, hours and minutes are descendants of years.
Slicer four-state check-boxes
Formatted check boxes in Multi-select slicers, known as four-state check boxes, are used to indicate whether or not all the descendant members of a parent member are checked, and whether new cube items that appear as descendants of the parent member are automatically included in slicers when a cube is processed.
The inclusion of items depends on which parent and descendant members are selected in a slicer.
Four states are used to indicate the status of the selection:
Checked with a solid border. Current item is selected(checked) and all descendants will have the same state. New cube members added as descendants will inherit this state automatically.
Unchecked with a solid border. Current item is NOT selected(checked) and all descendants will have the same state. New cube members added as descendants will inherit this state automatically.
Checked with a dotted border. Current item is selected(checked) but one or more descendants have the opposite state(not selected). New cube members added as descendants WILL be selected.
Unchecked with a solid border. Current item is NOT selected(checked) but one or more descendants have the opposite state(selected). New cube members added as descendants will NOT be selected.
Dynamic member selection
To create a dynamic entry in a slicer, first specify the static members, then create a tab on the Slicer placeholder that returns a dynamic member, for example Most Recent Period. More than one function may be added using this method, as shown below.
The resulting entries appear at the bottom of the slicer and can be selected. The entries dynamically revaluate the member function used each time the analysis is displayed.
When selected, the value returned by the function (instead of the member function's name) is displayed in the slicer.
Note
Any member function may be used. The most common functions used for this purpose are the Current Period, Most Recent Period, and Last Complete Period types.
Dashboard slicing
Dashboard slicing can use one or multiple of the various slicing elements to enhance dashboard interaction. Various slicer techniques like cell slicers, global slicers and slicers cells are available.
Slicer and filter precedence
Filter elements (filters and slicers) obey a series of rules of precedence (per hierarchy) to determine which filter elements are used to filter the data.
Each cube has one default measure group containing the default measure, which is determined when the OLAP cube is created:
If no measure is present in the resource, the default measure is used in the resource (including the slicer).
If the default measure doesn't relate to the current hierarchy, the hierarchy's measure is used.
The default measure is not denoted in the Dimension Tree. However, you can easily see what it is by creating a simple analysis (as shown below) where there is no measure on the Columns placeholder. The default measure is then automatically displayed in the analysis.
Note
It is recommended that you explicitly define a measure into any resource rather than relying on the default measure.