Analysis reports
Overview
Resizing rows and columns
Drag column and row boundaries to re-size the table (as you would in a spreadsheet). Select multiple headers to re-size at the same time (CTRL+Click).
When resizing columns and rows, an indicator appears showing you the size (in pixels) of the item.
Table formatting
Header selectors
Entire rows and columns can be selected using the row and column header selectors.
Note
Columns and Rows can only be selected in design mode.
Formatting options
Most table formatting can be located on the Table design panel. Available formatting functions are listed below, with further explanations where relevant.
Button | Item / Section | Description |
|---|---|---|
  | Styling | Text font weight and size, style, and background color. |
 | Clear formatting | Clear formatting. Allows you to clear all formatting, i.e. return to default |
 | Primary / Alternate Row | Specify shading for the primary rows (1st, 3rd, etc.) or the secondary rows (2nd, 4th, etc.) as described in Shading Analysis Rows. |
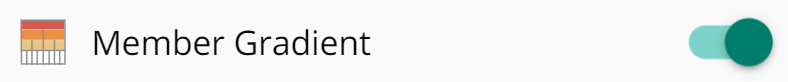 | Member gradient | Grades the default background color in hierarchies (specified background colors override this setting). |
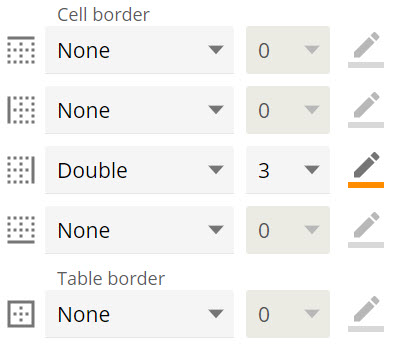 | Borders | Specify overall table and cell border styles, widths, and colors. |
 | Alignment | Specify cell alignment (left, center, or right), or indentation position |
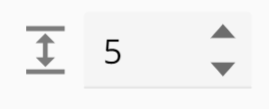 | Margins | Set cell margins (the space between the cell's text and the surrounding border). |
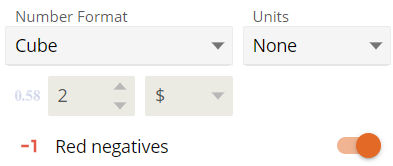 | Number style | Specify the predefined number style for highlighted rows or columns. Alternatively, a format string can be typed directly in the list box (offering precise format control). Both number and date format string types are supported. Color formatting is available for negative numbers. |
Primary and alternate row shading
Shading can be used on primary rows and alternate rows to make the analysis more readable.
Primary rows: These are the first row in your analysis, and every odd-numbered row after that.
Alternate rows: These are the second row in your analysis, and every even-numbered row after that.
Clearing analysis formatting
Important
This feature is relevant only to ISV's and others who are creating their own solutions.
When testing the import of a solution that you built, a warning may display about missing members. This warning indicates missing members will affect resource formatting. To fix the problem, return to the resources you exported, remove the incorrect formatting, and perform the export and import again.
Select ranges of cells in an analysis
Select ranges, or blocks of cells by using CTRL and/or SHIFT click, or by using the column and row headers.
CTRL-Click. Multiple individual cells can be selected by CTRL-clicking them
SHIFT-Click. By selecting a cell in the top left corner of a range, as well as the bottom right corner, a rectangular range of cells can be selected.
Member properties
Member properties provide additional information about members but cannot be used to slice or filter (e.g. descriptions, class and type). They appear when you hover over any member in an analysis report, as well as on the right click menu of a member.
In addition, all member properties can be seen grouped into the member properties folder in the Dimension Tree within each member level.
Subtotals and grand totals
Row and Column totals can be found on the Data design panel. Column and row totals and summaries appear as additional columns or rows.
Note
If the table is transposed (via the Data design panel), any existing subtotals are also transposed and displayed.
Subtotals cannot be used with other column or row summaries.
The right-click menu can be used to manipulate subtotals, and hide or display individual attribute columns.
The first attribute column cannot be collapsed.
Row and column filtering
Quite often, results in reports contain rows and/or columns that have zero or empty values. When many rows and/or columns are blank, you may wish to hide them to keep the report clean and easy to read.
Paging
The following tips may be useful when viewing and editing tables.
Freeze panes
To freeze the display of column and row headers in the report's table, use the Freeze Panes switch on the Table design panel.
Temporarily hide function pop-up window
When creating a custom named set, calculated member, or function, the resulting dialog box can sometimes extend over an area of the table. If you click the dialog tab, the box disappears but remains 'active', reappearing when you drag a useable entity on top of it (or click it).
You cannot place the focus anywhere else unless the function has become inactive, by either canceling or saving the last action.
Number of pages in a report
If the analysis returns a large number of rows or columns, the corresponding table is displayed on a per-screen basis. If a report has more than one page, a Number of pages button becomes visible on the toolbar.
Note
CTRL+Up/Down/Left/Right keys can be used to move to adjacent screens (e.g. use CTRL+Down to go to the next screen).
This feature affects only the display of the resource on the screen. Printing is handled separately.
Sorting
Sorting options on analyses are available on the right click menu of headers.
Removing and restoring members
When viewing reports, the report consumer may wish to remove some section of the data.
This can be achieved by using the Remove and Restore member functionality. Members that were removed can be restored again, once the Removed Members switch has been enabled.
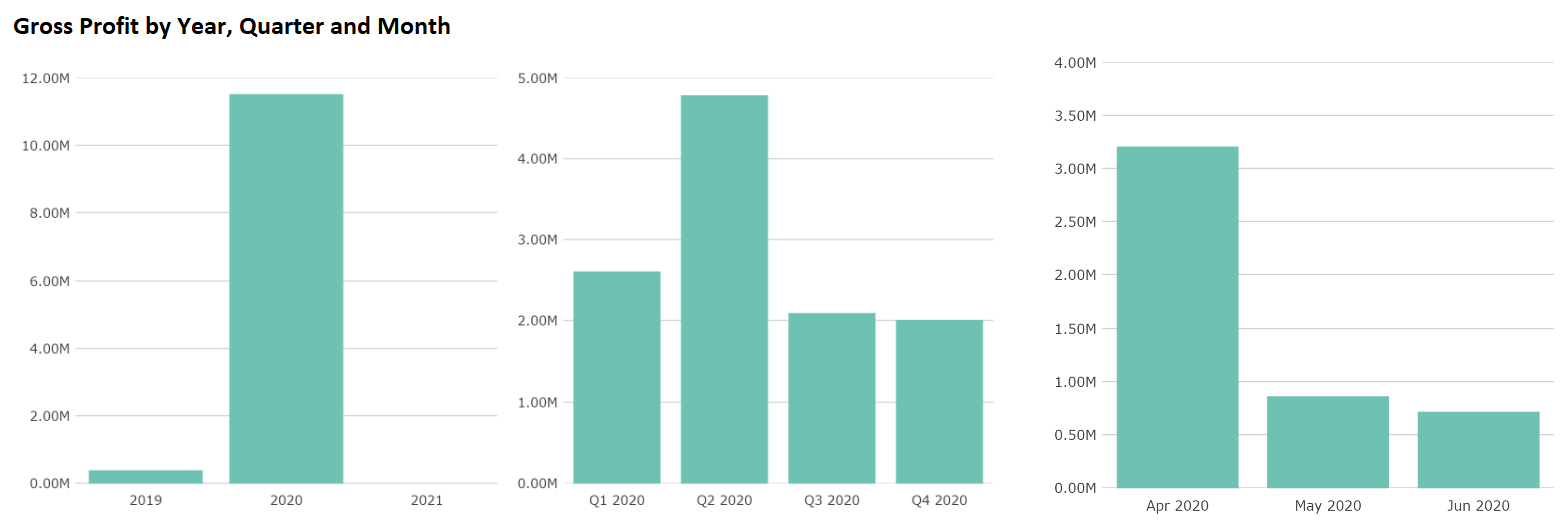
Drill up, drill down and drill through
Often reports start out showing data at a particular view or level, but frequently you want to see more or less detail or view the detail by another dimension for better decision making.
Drill up, Drill down and Drill through gives you the ability to change the granularity of reports as required.
Drill up
Drill up is like “walking through different levels of a hierarchy, from the bottom up”. It is mostly used to “undo” a drill down function.
Although many analysis or visualizations are shown on the top level of data by default, e.g. sales by year or quarter, there are also scenario’s that would require to start on the lowest level and drill up to the higher levels only if required.
Sales Reps may want to keep track of their sales by day but would also frequently want to drill up and see how they track for the month so far.
Drill down
Is like “walking through different levels of a hierarchy, from the top down”. For hierarchical data where values are grouped into levels, drilling down moves from one level down to the next.
Common hierarchies:
Date based data – Year, quarter, month and day.
Geographical data – Country, State, Postal code, City.
Sales by Month drilled drilled down to Sales by Day.
Hierarchical data is necessary in order to use the drill down functionality. A minimum of two levels are required for drill down, and there is no limit on how many levels you can have.
Drill through
Drill through can be thought of as navigating to “related data”. It allows you to explore data by taking you to another or different related report.
A detail report can be generated by drilling through (double click) on any cell or area of the report.
A custom report can also be created and saved as a detail report. This can then be added to a resource as a drill through target. This will automatically be opened on the double click action of the source report, with the context of the current selection or filters of the first report applied.
More than one detail report can be linked to a resource as a drill through target and can be opened via the cell right click menu
Drilling options
Several drilling options are available depending on the location where the drill action takes place.
Drilling on an entire analysis
Drilling on an entire analysis is achieved by not selecting an area of the analysis itself, but using the Drill Up and Drill Down buttons on the resource options menu.
Drilling on a selected heading. You can drill on a selected heading in your analysis by using the right-click menu or the resource options menu.
Drilling on a selected cell. You can drill on a selected cell in your analysis by using the right-click menu or the resource options menu.
Drilling on multiple cells or headings. You can multi-select cells or headings and then perform the drill action ONLY by using the resource options menu.
The behavior of drill up and drill down varies according to whether you have selected multiple cells or multiple headings.
Note
If multiple headings are selected, they must all be on the same axis and from the same level of the same hierarchy, otherwise, an Invalid selection for drill up/down error may appear.
You must use the buttons on the resource options menu for this function. Selecting multiple cells or headings, then right-clicking one of them and choosing Drill Up or Drill Down from the context menu will drill up or down on just the cell or heading that was right-clicked.
How drilling works behind the scenes
Drilling is implemented by wrapping and unwrapping tabs on the placeholders of the analysis in one of three functions:
Drill up
Drill down
Drill down restriction
These functions do not appear in the function explorer and cannot be used manually, however, they work like other functions.
Drill Up
The Drill Up function drills up to the level above the specified original set.
For example, the function could drill up to the level above the Quarter level (which is a set), to display the Year level.
Drill Down
The Drill Downfunction drills down on a specified set of members within a specified original set.
For example, the function could drill down on the Years level in the Fiscal Date Hierarchy to display the Sales on the level below it e.g. Quarters.
Note
When drilling down on the entire analysis, the second placeholder of this function is not used, because the action is performed for the entire report, and not only a particular member.
Drill Down Restriction
The Drill Down restriction function restricts the specified original set to displaying only a specified set of members.
For example, American Customers have sales in 2019 and 2020, but the drill down action was done on American Customers for 2020, so the Year level is restricted.
Sparklines and KPIs in a table
Sparklines are a convenient way to add visualization components with feedback on some history to an analysis report. On a Sales order analysis you may want to see the sales over the last 6 or 12 months graphically alongside other relevant numbers.
A sparkline function has the following components:
Number of Data points. Specifies the number of points for which the measure specified should be measure. E.g. A Sales by month sparkline will have 6 or 12 as the number of points measured.
Formula. Holds the values to be measure, e.g. sales in this example
Time Context. Specifies the time period when the sparkline ends. Leaving this placeholder empty will use the current period as the time context.
For the example below, Sales for 6 months will be displayed until Dec 2020 because the time context comes from the Month level of the Fiscal Date Hierarchy.
Important
If no time members are present in your current query, Data Hub will not be able to determine the time context automatically. In this scenario, you must specify a member to represent the desired time span.
Print design
Print Design controls how the analysis will look when printed. Enable the switch to see the various options.
Print Preview. Located on the Resource Options menu, opens a new window, which displays the resource as it will appear when printed.
Orientation. Specifies if the resource will be printed using the portrait or landscape orientation.
Page Size. Specifies the size of the paper on which the resource will be printed.
Page Numbers. Specifies if page numbers will appear in the footer of each page, and if so, where the page number will display.
Margins. Open the Margins dialog box, which allows you to specify, in points, the exact size of the top, bottom, left, and right margins.
PageAlignment. Align both top-to-bottom and left-to-right alignment for the contents of the page. These two alignment types are independent of each other.
Scaling. Adjust the size of the analysis to get it to fit on the printed page in a specific way. You can fit by all contents, rows, columns, or create custom scaling. You can also use the default size and print the analysis using its regular, full size.
Pages Wide. When Custom Scaling is selected using the Scaling button, this text box becomes active, allowing you to specify the number of pages onto which the analyses columns will be fit. The columns themselves are resized to fit on the number of pages you specify.
Pages Tall. When Custom Scaling is selected using the Scaling button, this text box becomes active, allowing you to specify the number of pages onto which the analyses rows will be fit. The rows themselves are resized to fit on the number of pages you specify.
Page Number Increase Layout. If your printed analysis contains multiple columns and pages, you can use this option to specify how the numbering of the pages is handled.
If Down, then Over is selected, the pages are numbered based on columns, with the pages in the first column initially numbered, then the pages in the second column, and so on, as shown below.
If Over, then Down is selected, the pages are numbered based on rows, with the pages in the first row initially numbered, then the pages in the second row, and so on, as shown below.
Reset Page Breaks. Resets any defined page breaks to fit the currently selected paper size (set via the Paper Size button).