Detail reports
Overview
When drilling through on any cell or area of a report, a detail report is created. Detail reports display the low-level or related data of an aggregate value of a Measure Group. Detail reports can be saved so that they can be used as a drill through target.
Note
Detail reports extract all data related to the target cell at a transactional level. Therefore, rows do not need to be defined by row placeholder tabs.
There are two methods for creating a detail report. Drilling through by double clicking a report cell or by creating a Detail report from the New Resource menu.
Create a detail report by drilling through
Double clicking any cell or area of a report is known as drilling through.
When a drill through is performed on a cell with no defined drill through target report, the drill through result is presented as a new unsaved resource. The resource includes:
All of the data in the cube for the measure group related to the report cell selected.
All measures in the measure group related to cell.
The sets used to define the rows and columns on the source report, translated to slicers for the detail report.
Slicers on the source report, included as slicers on the detail report.
This detail report can then be saved.
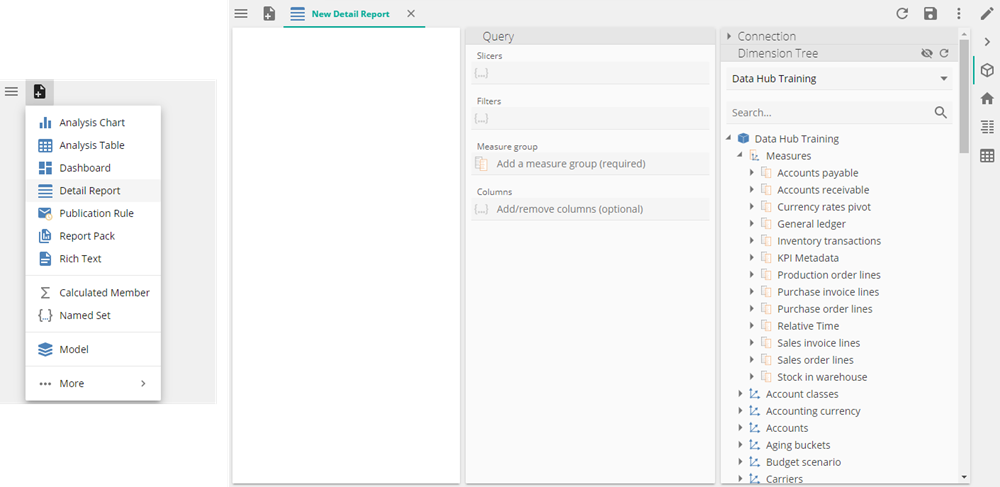
Create a detail report via the New Resource menu.
Custom detail reports, containing fewer columns and additional filters, slicers and formatting, can be created from the New Resource menu.
Select an entire measure group from the Dimension tree to be added to the Add a measure group placeholder. Customizing detail reports can be done by adding slicers, filters and changing the columns that appear. The formatting can also be changed.
Once this report has been saved, it can be used as a drill through target report, by adding it to the drill through target report placeholder on analyses or the drill through link item on a dashboard cell.
Note
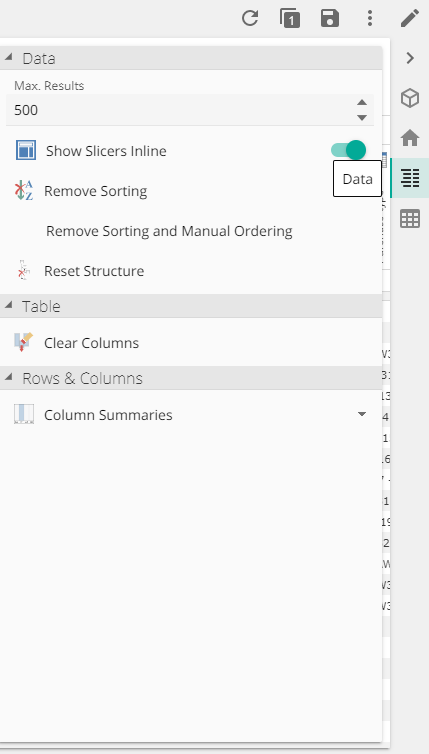
The Max. Results field on the detail report's data design panel determines how many rows can be shown when the resource is viewed. If the report returns more than the specified number of rows, a warning is displayed. You can then choose to adjust the report's filtering or the Max. Results value so that all rows of the report are returned.
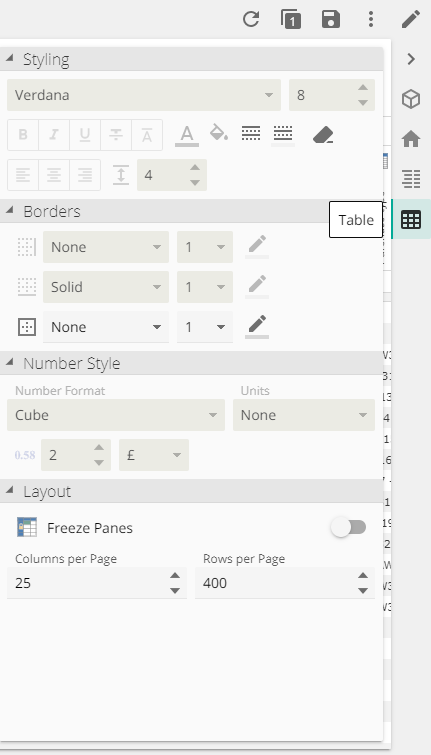
If the analysis returns a large number of rows or columns, the corresponding table is displayed on a per-screen basis. A Number of pages button displays on the toolbar allowing you to move from one screen to another. The maximum number of rows and columns displayed on each screen is defined using the Layout section of the Table design panel
For multiple-page tables, the CTRL + UP/DOWN/LEFT/RIGHT keys can also be used to move to adjacent pages (for example, use CTRL + DOWN to go to the next page).
Creating a drill-through will fail if you do not have the 'Drill Through' permission in your assigned Role (under the Resource Specific Permissions section). Only an administrator can change user Roles.