Work with dashboards
Create a dashboard
Note
It is not possible to increase the size of the design canvas.
Click New Resource > Dashboard.
Drag existing resources from the Resource Explorer to the design canvas. Inserted resources will only display fully if the resource data is available.
Click Save.
Filters and slicers
Note
The dashboard must be in Design or Edit mode to add filters and slicers.
If you want to work with only a single dashboard resource, click the check-box at the top right of the resource to select it before clicking Design.
If no single dashboard resource is selected, the placeholders apply to all dashboard resources.
Filters
Use the Filters placeholder to refine the data displayed in the dashboard.
Click the Dashboard Filters placeholder to create a custom formula, named set, or function or,
Drag a hierarchy or level into the section.
Click Save.
Slicers
Resources can be sliced in canvas cells by other resources (such as a named set or slicer resource). You can use any of the following methods.
Dashboard slicer. Slice all dashboard cells.
If a dashboard cell is selected, un-select it by unchecking the selection checkbox.
Drag a resource into the dashboard's Slicer placeholder.
Within-cell slicer. Slice only a selected cell.
Select a dashboard cell by clicking its selection checkbox.
Drag a resource into the cell's Slicer placeholder.
Inter-cell slicer. Use a resource in one cell as a slicer for another cell.
Hover over the title bar of the cell that will be the slicer. The cell must contain an analysis, chart, or drill-through resource.
In the top right corner of the cell's title bar, click the Slicer button. (It looks like a scalpel.)
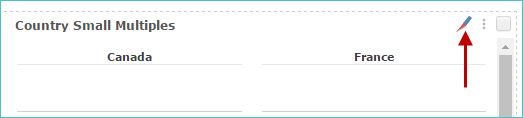
The slicer cell is now displayed with a green background, and a Slicer icon appears in its center.
Click anywhere inside the cell to be sliced.
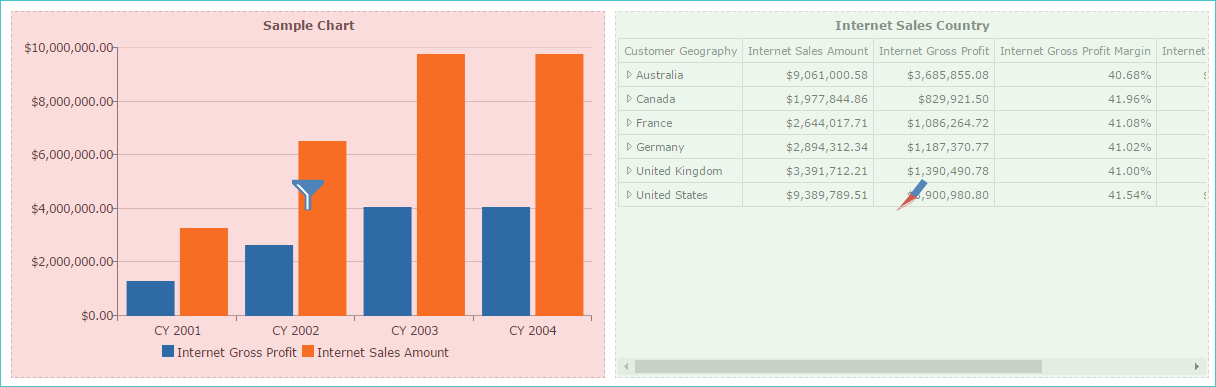
Once the slicer is in place, the sliced cell is displayed with a pink tone, and a Slicer Resource icon (It looks like a pie chart.) appears in its center.
You can remove the cell from the slicer by clicking it again. When clicked, the Slicer Resource icon (pie chart) disappears, and the pink background color is removed when you move your mouse pointer off of the cell.
Repeat the previous step for any additional cells that need to be sliced. In the following example, the Internet Sales Country analysis (on the right) slices the Sample Chart (in pink on the left).
Click anywhere inside the slicer cell (with the slicer icon) to complete the process.
The blue and pink colors disappear.
To edit or check the slicing, repeat step 2 above. The slicer cell and cells being sliced again appear colored blue and pink, respectively.
Slicer cell. Create a drop-down list of items that you can use to slice other cells.
Drag a cube element, such as a level, to the center of a blank dashboard cell.
The cell displays a drop-down list of items that you can use to slice other cells.
Use the steps described in the Inter-cell Slicer section (above) to configure which cells are sliced by the slicer cell.
Tip
You can click within the slicer cell to select it, but not on the drop-down list. Now the slicer appears as a tab in the cell's Slicer placeholder. You can now add additional slicers by dragging them to the cell's Slicer placeholder, and right-click a slicer tab to change its slicer type.
Note
"Starts-with" Slicer search. When searching for single-select, multi-select, or time context slicer types for both the design and consumer pages, type three or more characters in the search box. You will automatically be shown a list of slicer options. Select from this list to quickly jump to a slicer.
After searching for a slicer, the member list will not refresh until you hit either Enter or Tab.
Add other resources to a dashboard
Note
All resources to be added to a dashboard must first be located in Resource Explorer.
Add a rich text cell to a dashboard
Rich text resources allow you to define a text object, or Microsoft Word-like document, that can be reused in other resources (for example, to create dashboard titles).
The rich text editor offers a simple interface where text, images, calculated members, or named sets can be easily added and formatted.
Additionally, the background syntax is HTML, so advanced users have the option of creating complex HTML statements with user-defined layouts and dynamic Javascript inclusion.
Locate the rich text resource in the Resource Explorer.
Click and drag the resource to your dashboard and place where required.
Click Save.
Add an image or web page cell to a dashboard
Click an drag an image to your dashboard and place where required.
Click New Resource > More > Image.
Click the Upload button, and select the image from your system or network.
Click Save.
Specify a name and folder location for the image. Click OK.
Locate the image in the Resource Explorer.
Click and drag the image to your dashboard and place where required.
Click Save.
Click an drag a webpage to your dashboard and place where required.
Click New Resource > More > Webpage.
In the Address text box, specify the web page address and press ENTER.
If you have to update the web page address, you can check the altered URL's validity by clicking Refresh.
Click Save.
Specify a name and folder location for the resource. Click OK.
Locate the webpage in the Resource Explorer.
Click and drag the webpage to your dashboard and place where required.
Click Save.
Personalize your dashboard
Background color
Change the color of specific cells or dashboard background, using Background Color on the Design panel.
To change the background color for the entire dashboard, verify that no individual cells are selected in the dashboard.
To change the background color for a specific cell, select the check-box at the cell's top right.
On the Design panel, click Background Color.
Select from the provided colors or click MORE COLORS to use the color picker tool or enter a HEXColor code.
Click Save.
Specify the color of chart text or cell titles
You can change the text's color in chart or cell titles using Foreground Color on the Design panel.
To change the background color for the entire dashboard, verify that no individual cells are selected in the dashboard.
To change the background color for a specific cell, select the check-box at the cell's top right.
On the Design panel, click Foreground Color.
Select from the provided colors or click MORE COLORS to use the color picker tool or enter a HEXColor code.
Click Refresh to preview your changes.
Click Save.
Determine the color palette
You can use Palette on the Design panel to specify the colors that appear on your dashboard reports.
Important
This color selection only affects dashboards.
Add a background image.
Click New Resource > More > Image.
Click the Upload button, and select the image from your system or network.
Click Save.
Specify a name and folder location for the image. Click OK.
On the Design panel, click Change Background.
Select the previously uploaded image and click OK.
Click Image Display.
Select how you want the image displayed.
Click Save.
Specify a dashboard title
By default, dashboards do not have titles. However, you can add one using the Edit Title button. Once specified, titles are automatically added to a new cell at the top of the dashboard.
On the Home panel click Edit Title.
Add and format text for the title.
Click OK.
Click Save.
Specify a cell title
By default, a cell title is created using the corresponding resource's name. This title can be changed using the Rename Cell button.
Note
All cells are required to contain a title.
Select the cell that you want to rename.
On the Design panel, click Rename Cell.
Change the name of the cell and click OK.
Click Save.