Rich text resources
Overview
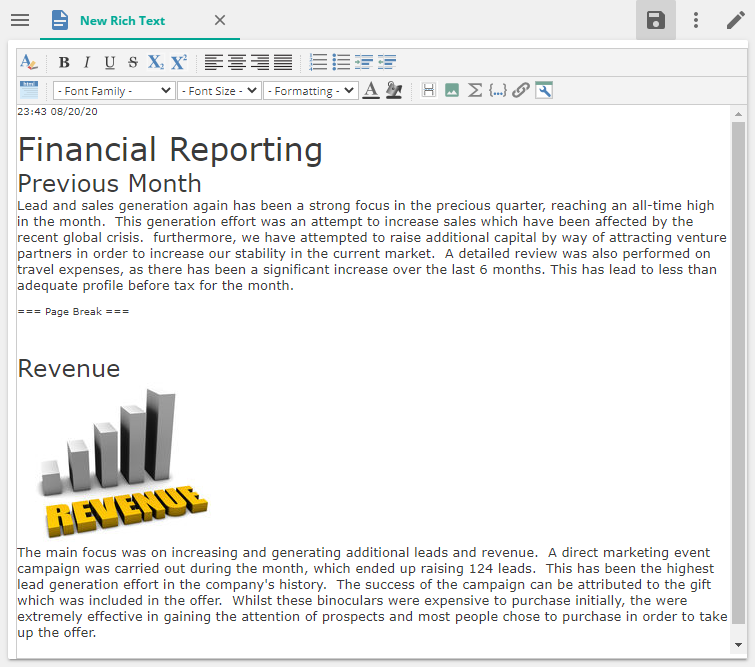
Rich text resources allow you to define a text object, that can be reused in other resources like dashboards providing valuable supporting information for other analytical resources. The rich text editor offers a simple interface where text, images, calculated members, or named sets can be easily added and formatted.
Rich text resources are useful for including non-analytical supporting information or summaries, and are often included as components of report packs.
For example, a rich text resource could include an executive summary for a quarterly report, analytical or conclusive commentaries on provided analysis reports, or even a high-resolution company logo for use as a title page.
Formatting options
The rich text editor's toolbar is used to control the formatting of text in a rich text resource. In addition, you can switch between using standard text and HTML. The large white text area is used for the actual content (text, images etc)
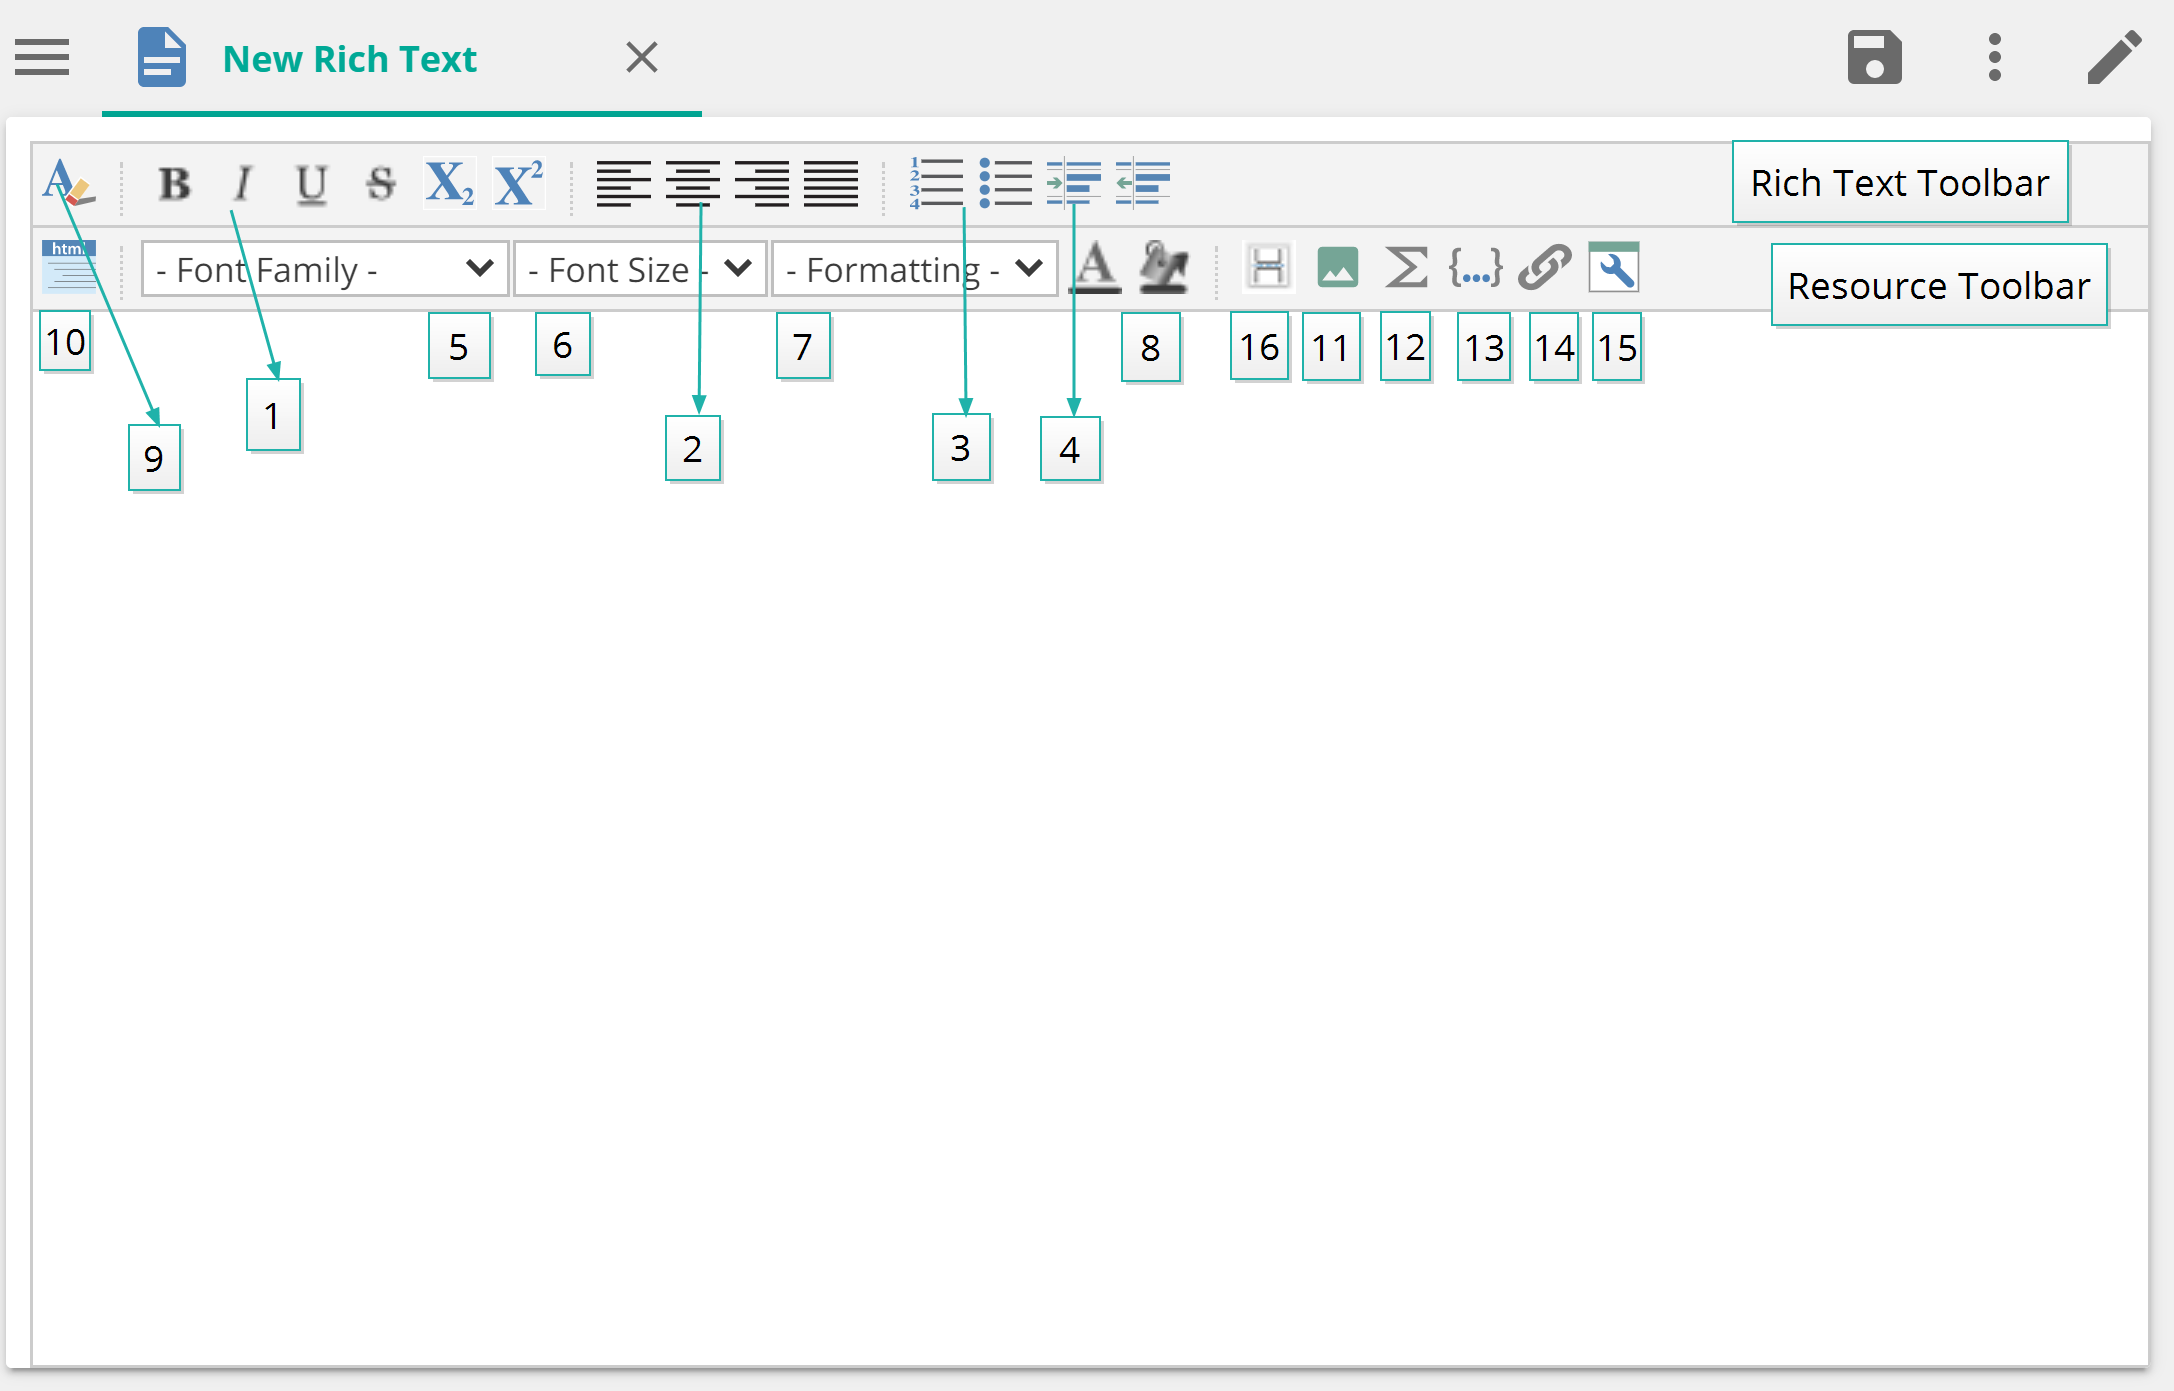
1 | Control the appearance of the resource's text. |
2 | Control the alignment of the resource's text. |
3 | Create bulleted and numbered lists. |
4 | Indent paragraphs or remove paragraph indentation. |
5 | Select the type of font you want to use. |
6 | Select the size of the text. |
7 | Select predefined formatting options (such as various heading levels). |
8 | Add color text or the text backgrounds. |
Interface features:
9 | Remove the selected formatting options. |
10 | Change between the standard plain text editor and the HTML (code) editor. |
Images and links in rich text
You can insert items of information (such as images and links to other resources) into a rich text resource using the buttons on the right side of the resource's toolbar.
Note
These types of items must already be defined and available via the Resource Explorer.
Images are not automatically resized when printed. Images that are larger than the page size are cropped. If necessary, you should adjust the image in the rich text resource's editor before printing.
If a calculated member's value or named set's value is not available, the value is replaced by the "empty filter" string in the rich text resource.
11 | Insert an image |
12 | Insert a calculated member |
13 | Insert a named set |
14 | Insert a link to another resource |
Dynamic fields in rich text
You can insert dynamic fields into your rich text resource via the Insert More button. These are similar to fields in a Microsoft Word document. These fields
contain information that is automatically generated by the application, such as user and date information.
15 | Dynamic fields |
Once you select one of the following options, the following details are inserted directly into the rich text resource (at your current cursor location):
Created By | The name of the user who created the rich text resource. |
Created On | The date, time, and timezone when the rich text resource was created. The date format may be controlled as detailed in Formatting Dynamic Date Fields, below. |
Modified By | The name of the last user who modified (edited) the rich text resources |
Modified On | The date, time, and timezone when the rich text resource was last modified (edited). The date format may be controlled as detailed in Formatting Dynamic Date Fields, below |
Executed For | The name of the user for whom the resource was generated. |
Executed On | The date, time, and timezone when the rich text resource was last generated. The date format may be controlled as detailed in Formatting Dynamic Date Fields, below. |
Last process Time | The date, time, and timezone when the cube was last processed. The date format may be controlled as detailed in Formatting Dynamic Date Fields, below. NoteThis field will return an error (Last processed time is unavailable: no connection or more than 1 connections) if you insert it into a stand-alone rich text object. For the field to work, the rich text object must have access to a cube. This is usually done by embedding it in a dashboard with a date slicer. Adding a title to an analysis also creates a rich text object with access to a cube via the analysis. |
Format dynamic date fields
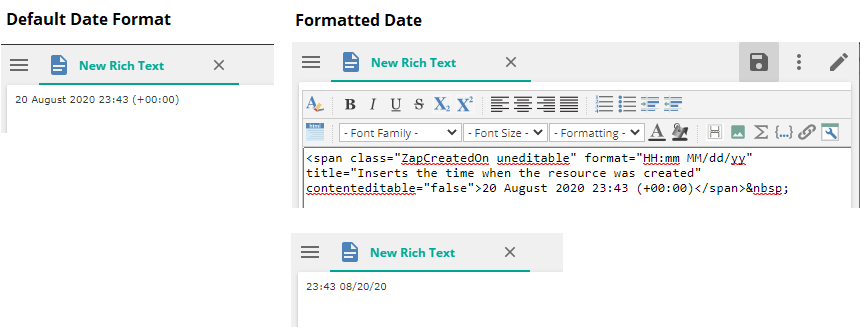
If a dynamic date field (Created On, Modified On, Executed On, or Last Processed Time) is added, it appears in a default date format. You may alter the appearance of the date and time that appears by adding a format string to the field.
Click to place the cursor immediately after the date field.
Click the Toggle HTML View button at the left of the resource tool bar to switch to HTML view (highlighted in the image below).
Use your arrow key to move the cursor and in front of the title attribute add a format attribute ( format="HH:mm MM/dd/yy"), as shown in the image below.
Change the format string between the double quotes to any format string you require. See http://msdn.microsoft.com/en-us/library/8kb3ddd4(v=vs.110).aspx for details of the format string syntax.
Sparklines in rich text
You can use the Status function to add sparklines to analyses, which give you a quick, visual references to the current state of a measure or calculation.
The Status function allows you to specify the measure or calculation whose current state you want to display, the boundaries used to determine the state, and which range within these boundaries is optimal.
Optimal states are given a green icon. Non-optimal states are given a red icon. Mid-range states are given an orange icon. You can determine which ranges are optimal, non-optimal, and mid-range when defining the Status function.
Page breaks
16 | Page Breaks |
Page breaks can be added by placing your cursor in the desired location and insert a page break via the resource toolbar button.
Note
When deleting a page break, place the cursor behind the last text in front of the page break and press delete on the keyboard.
Page breaks are only visible in the print preview or generated PDF document.