Steps
Overview
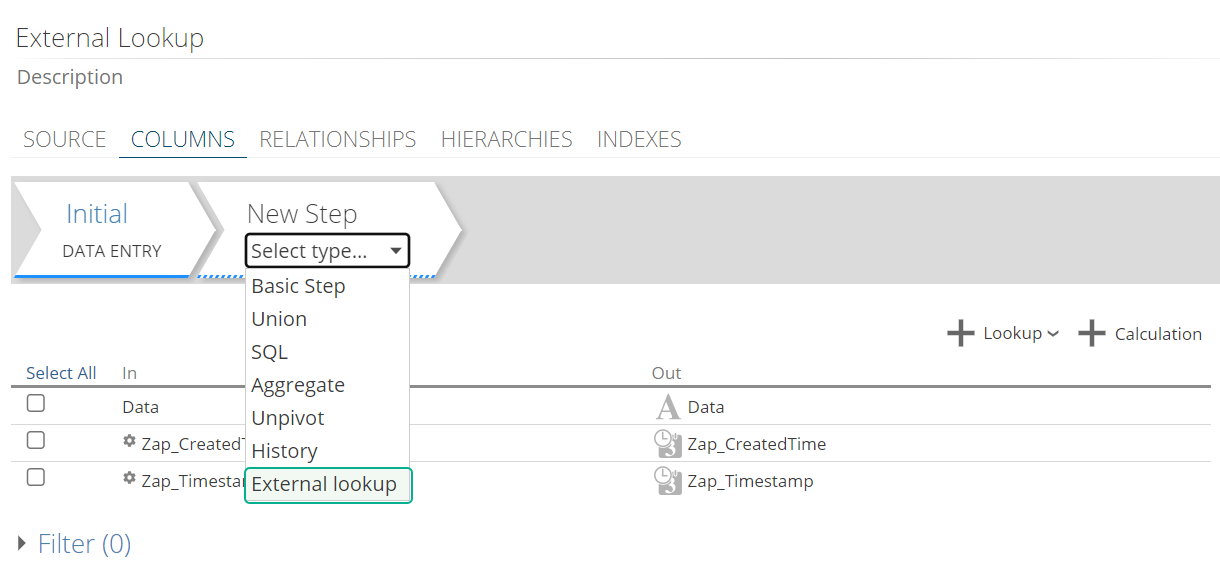
Steps are pipeline settings that perform column transformations. Once you add a pipeline, you usually need to add steps and their corresponding column details using the COLUMNS pipeline tab. The first step takes its input from the pipeline’s source (often a table from a data source). The Initial step (default) allows manipulations for:
Pipeline schema changes.
Lookups.
Calculations.
Filters.
Although each pipeline contains an Initial step, other step types can be added to existing pipelines. Additional manipulations are allowed for the other step types.
Steps are sequential, i.e., only data that fits a previous step will be available for the next step. For example, if you have filtered out all sales representatives from region 1 in a basic step, their data will not be available when you add an aggregate step next.
Note
If a step performs an additional operation (such as the SQL in an SQL step, a union in a union step, or an aggregation in an aggregation step), the additional operation is performed before the column changes, lookups, calculations, and row filters are applied.
In and out columns
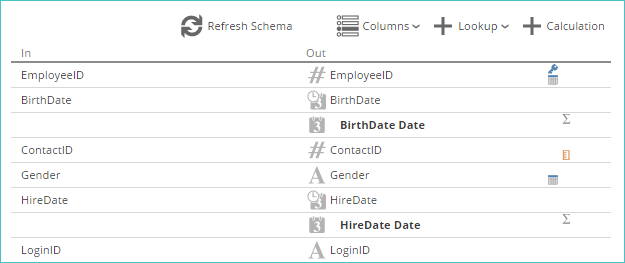
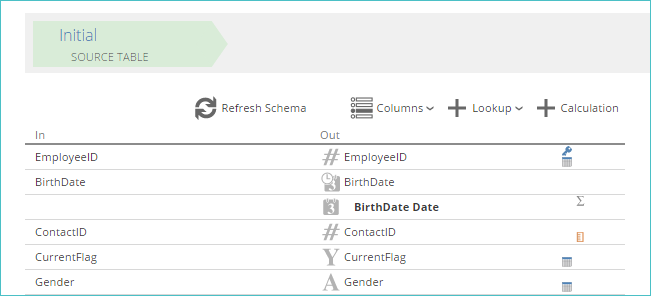
The following information is displayed on the COLUMNS pipeline tab.
In column. Represents the column’s name as it appears in the data source (for the Initial step) or in the previous step (for all subsequent steps). Some data sources allow the application to show easy-to-read names in this column.
For the Initial step, these source column names display both the caption and physical name (in parenthesis) if a caption is present in the source data (e.g., CRM data sources). This formatting matches the format displayed when the Columns button is clicked.
Out column. Represents the column’s name as it will appear in the next step or, if it is in the last step, how it will appear when used in reporting. It also includes icons showing the column's data type.
Icons column. Displays icons showing properties for the column (e.g., measure, attribute, calculated column).
 |
Columns in bold
A column or step that has been modified or added will appear in bold text in the In or Out column of the COLUMNS pipeline tab.
Important
This highlighting impacts only column information that can be changed on an individual step basis (e.g., a column's name, data type, or any added columns such as a lookup). Changing pipeline-specific information, such as column measure or attribute settings (visible in the Properties pane), does not highlight the column.
This feature allows you to easily determine that a change has been made to a column since the corresponding schema was initially imported from the source data.
Note
Custom rules for Union, SQL, and Aggregate steps do not use this highlighting.
Step types
Several step types are available within pipelines. Each one provides a different type of functionality.
Processing order of step types
The functionality of Aggregate, Union, Unpivot, and History steps is in addition to the features of the Initial and Basic steps. This additional functionality of other step types is performed before the tasks in the Basic step during processing.
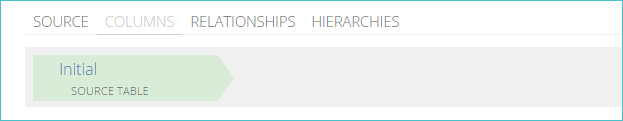
Initial step type
The initial step appears as the first step in all pipelines (default). It lets you choose which columns to load into the data warehouse. Loading only those columns from the data source that are needed will save time when processing the model and reduce the size of the data warehouse database.
The initial step is important because its primary key governs the granularity of the pipeline in the data warehouse (but not in the cube).
 |
Configuring the initial step
The initial step is used to select the columns from the source used in the pipeline.
 |
Two options (only available in the Initial step) that assist with column selection are:
Refresh Schema button - Verify that you view the most up-to-date schema information from the data source.
Columns button - Remove unwanted columns from the staging table.
When unwanted columns are removed, they are not available elsewhere in the pipeline. Removing columns speeds the load process by reducing data volume that must be transferred from the source database to the staging table. It also reduces the size of the staging table in the data warehouse.
Basic step type
The basic step is the default step type and the simplest of all the available steps. It provides the most common settings for configuring columns in a pipeline.
Note
All other step types include the features of the basic step, along with additional features. Other step types perform their specific actions before the tasks below are performed. For example, a SQL step executes its SQL before any lookups, or calculated columns are created.

The following tasks are performed within a basic step, in the order listed:
Adjust columns by:
Renaming columns.
Setting key columns.
Assigning data types.
Adding settings for reporting (such as whether each column is a measure or a dimension).
Add lookup columns for using data from related pipelines.
Add calculated columns.
Delete columns.
Filter rows.
Note
If these actions need to occur in a different order, you must perform the second action in a subsequent step.
The following common scenarios will require the second action to be performed in a subsequent step:
Creating a calculated column then using it as a lookup column.
Deleting a column and then using it in a filter.
In the following scenarios, both actions may be performed in the same step:
Creating a lookup column, then using it as the basis for a calculated column.
Using a column in a calculation or lookup and then deleting it.
Using basic steps
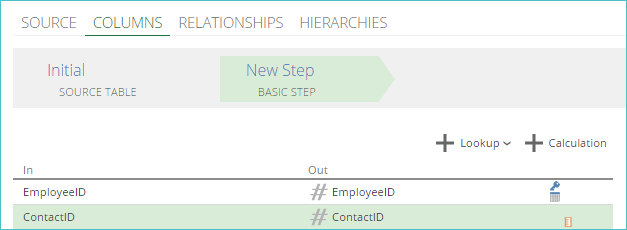
A basic step is used to map input fields to output fields. It is identical to the Initial step, except it does not provide access to the Refresh Schema or Columns buttons.
These steps are created using the Basic Step option that appears when an existing step is clicked.
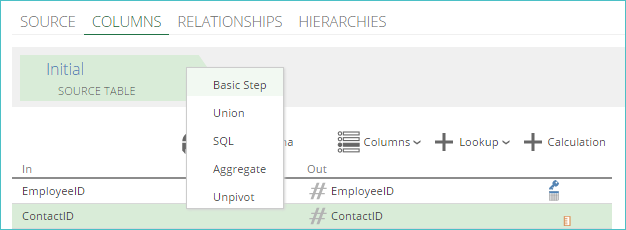 |
Once clicked, a mapping step is added to the COLUMNS pipeline tab.
 |
About the SQL step
The SQL step offers a text box where a valid SQLSELECT statement may be entered to manipulate data.
Note
This functionality is in addition to the features of the Basic step, which are included in all step types. This functionality is performed before the tasks detailed for the Basic step.
Tip
Example
The default statement is as follows:
SELECT * FROM @IN
The @IN formation represents the input to the SQL step resulting from the previous step in the pipeline. Columns from other pipelines in the warehouse may also be used.
Key points:
After the SQL is executed - Column Change, Lookup, Calculation, and Filter operations may also be applied.
SQL steps are typically used when you need to access multiple columns from two or more pipelines, rather than just a single column from another pipeline available with a Lookup operation.
SQL steps may also include WHERE clauses to reduce the amount of data passed through the pipeline.
Filters
The Source Filter list lets you define a filter applied to the step’s input set of rows. This allows you to reduce the rows passed through to the next step. The row filter uses Boolean logic to combine multiple true/false statements.
Add a filter
Expand the Filter list.
Click the + Condition button to add a row to the filter list.
Configure filter
Click the Column drop-down list, and choose a column for the filter.
Click the Operator to choose an operator for the filter.
The following operators are available:
Equal - A comparison using this operator is true if the entries on each side have the same value.
Greater than - A comparison using this operator is true if the entry on the left is larger than the entry on the right.
Greater than or equal - A comparison using this operator is true if the entry on the left is numerically larger than or equal to the entry on the right.
Less than - A comparison using this operator is true if the entry on the left is numerically smaller than the entry on the right.
Less than or equal - A comparison using this operator is true if the entry on the left is numerically smaller than or equal to the entry on the right.
Contains - This operator requires that one side contains a column and the other side contains a literal value. The column may be on the left or the right. Supplying two columns or two literal values will result in an error. The operator works only with text string values; supplying other data types will result in an error. A comparison using this operator is true if the supplied column text string contains the supplied literal text string.
Starts with - This operator requires that one side contains a column and the other side contains a literal value. The column may be on the left or the right. Supplying two columns or two literal values will result in an error. The operator works only with text string values; supplying other data types will result in an error. A comparison using this operator is true if the supplied column text string starts with the supplied literal text string.
Ends with - This operator requires that one side contains a column and the other side contains a literal value. The column may be on the left or the right. Supplying two columns or two literal values will result in an error. The operator works only with text string values; supplying other data types will result in an error. A comparison using this operator is true if the supplied column text string ends with the supplied literal text string.
Has value - A comparison using this operator is true if the supplied value is not null and not an empty text string. The operator works only with text string values; supplying other data types will result in an error. Only a single entry may be present. An error results if both the left and right-hand sides are filled in.
Is null - A comparison using this operator is true if the supplied value is null. Only a single entry may be present. An error results if both the left and right-hand sides are filled in.
Is empty text - A comparison using this operator is true if the supplied value is empty text. The operator works only with text string values; supplying other data types will result in an error. Only a single entry may be present. An error results if both the left and right-hand sides are filled in.
Is any of - A comparison using this operator is true if the value on one side is present in the comma-separated list of values on the other side. Comparing two columns with this operator is the equivalent of using the Equal operator.
If the specified values contain legitimately embedded commas, you can prevent these commas from acting as item separators by escaping them: preceding each one with the backslash (\) character.
Tip
Example If you need to supply a list of three industry sectors:
Construction
Media
Food, Drink, and Tobacco.
Action: Escape the comma in Food, Drink and Tobacco and enter Construction, Media, Food\, Drink, and Tobacco (placing a backslash before the comma after "Food").
Note
The operators are implemented using T-SQL operators or functions. To understand the precise behavior of these operators, consult the following T-SQL documentation:
The Contains, Starts with, and Ends with operators use the SQL LIKE operator with appropriate wild cards.
The Is null operator uses the SQL ISNULL function.
The Is empty text operator explicitly compares the value against an empty string ('').
The Is any of operator uses the SQL IN operator.
If necessary, click the Not column to the left of the Operator text box to negate the condition.
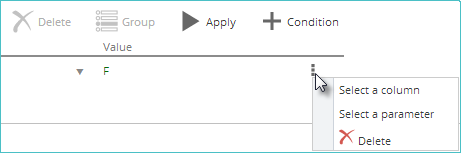
Finally, type a value into the Value combo box. The example below shows a filter configured to pass only female employees to the next step.
Click the stacked squares icon to the right of the Value text box to display a context menu that lets you change it to a column selector. This action lets you create filters that compare the value of one column (field) to the value of another column. (e.g., comparing the value of the sale price of an item to its cost price.) Another option in the menu lets you select a parameter. The context menu also can delete the condition, as shown below.
Note
Multiple conditions may be added and combined with Boolean operators to create more complex filters.
Complex filters
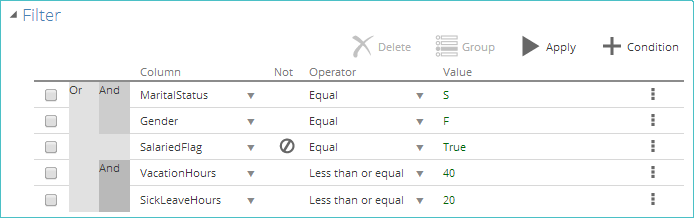
Create complex filters by adding multiple conditions. By default, all conditions are combined with a Boolean AND operator – meaning that all must be true for the row to be passed through the step.
The structure of a multiple-condition filter may be altered by selecting two or more consecutive conditions (using the checkboxes at the left of the condition list) and then clicking the Group button. This action combines the selected conditions with an AND operator.
Clicking the AND operator toggles it to an OR operator. Previously-grouped conditions may be reselected, and additional grouping added.
The example below shows a complex filter with multiple, grouped conditions. This filter could be expressed in English as "show single females, non-salaried employees, and employees with low leave entitlements."
 |
Step settings
The COLUMNS pipeline tab is where steps (and columns) are managed.
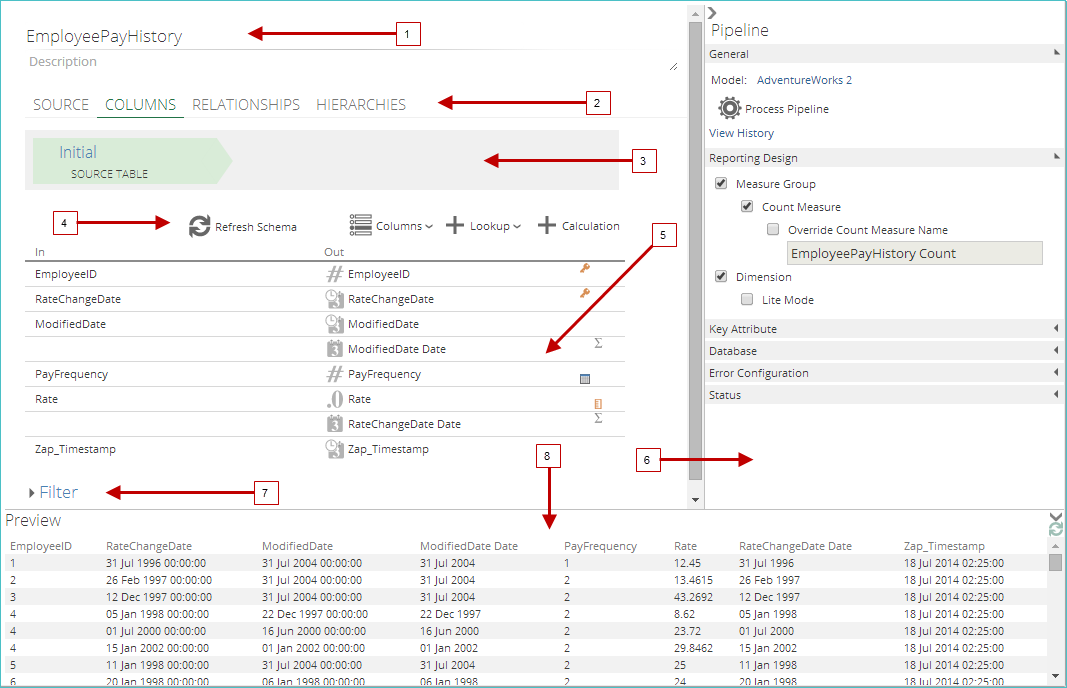
The COLUMNS pipeline tab can be divided into eight regions (outlined below).
Pipeline’s name and description.
Four pipeline tabs.
Step selector area. This displays the pipeline’s steps in execution order. Clicking a step’s outline in the step selector area selects it and displays its settings beneath.
Buttons for adding functionality to the step (Lookup, Calculation, Columns, and the Refresh Schema button).
Pipeline schema. This displays a list of input and output columns to the step. Also shown are icons representing the data type of each output column and icons indicating how each column will appear in the cube.
Properties panel. Selecting a column’s entry in the schema displays its settings in the Properties panel. Clicking a background area of the screen immediately to the left of the Properties pane deselects the column, and the Properties panel displays the pipeline’s properties.
Filter list. This displays all defined filters and buttons that can be used for manipulating them.
Preview pane. This shows a preview of the current step’s output.
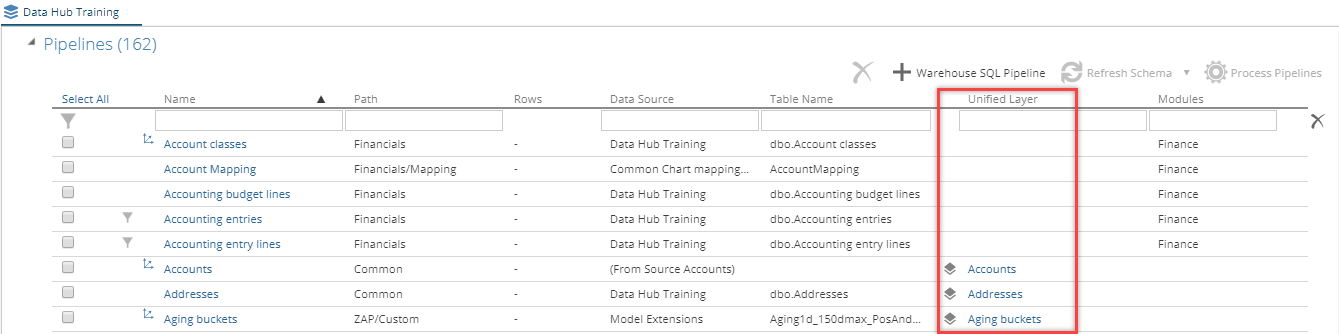
Unified Layer column
 |
Click the link to see the unified layers associated with the pipeline.
Aggregate step type
An aggregate step lets you summarize the rows in a pipeline using the SQL GROUP BY clause. You can select which grouping operator to apply to each column and use pre-set templates to implement aggregations that ignore duplicates or summarize duplicates quickly.
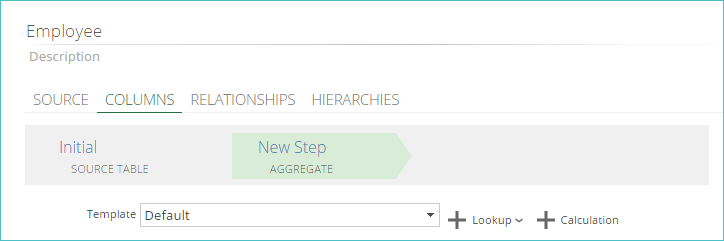 |
After adding an aggregate step, you need to choose the template to apply using the Template drop-down box. An aggregation operator is applied to each column according to the template’s settings. Standard step configuration options are also available.
Union step type
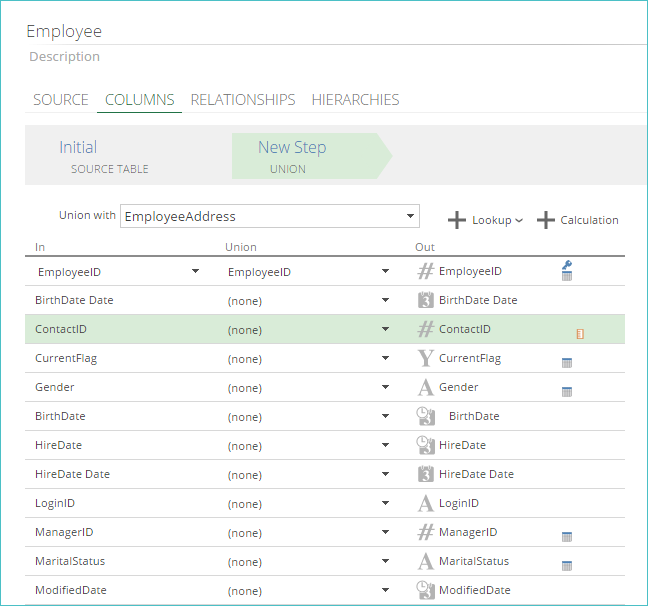
A union step performs an SQL union. It allows you to append the rows from one pipeline (the input pipeline) to those in another (the union pipeline) and map the corresponding columns between the two pipelines.
If a column name cannot be matched automatically, you can manually select the corresponding column in the union pipeline that should be mapped to the column in the input pipeline.
 |
Note
Column Change, Lookup, Calculation, and Filter operations may also be applied after the union operation.
Default union step behavior
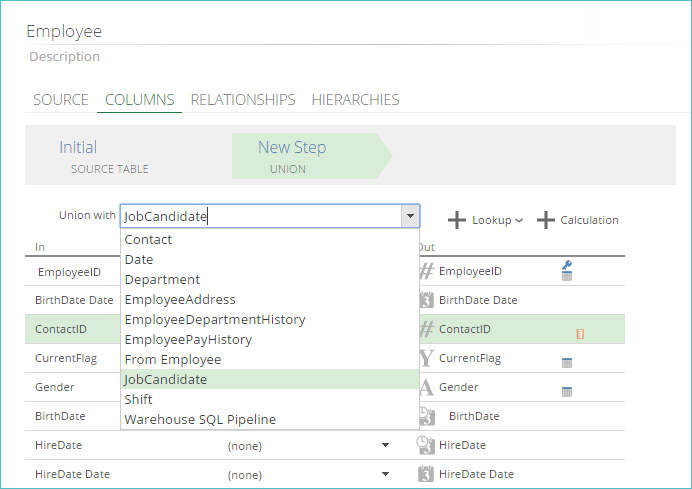
When a Union step is first added, and a pipeline is selected from the Union with a drop-down list, several changes are automatically made in the COLUMNS pipeline tab.
The input pipeline (Employee) has been opened in the image below and is being combined with a union pipeline (EmployeeAddress).
 |
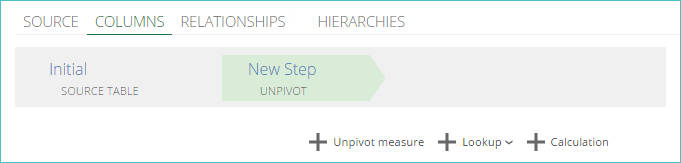
Unpivot step type
These steps are used to transform cross-tabulated data into a simple relational table form by rotating input columns into row values.
 |
Key points:
A pivot column will contain the pivot key values. These form a set consisting of the name of each column that can be rotated.
An unpivot measure column will hold the values that previously resided under the columns being rotated.
An unpivot step is typically used to transform information that resembles a pivot table in a spreadsheet into a relational form, suitable for joining other pipelines in the model so that reports can be easily created.
Tip
Example
The table of monthly sales figures for each product features the headings: Product Name, Jan, Feb, Mar.
An unpivot step results in a table with the headings: Product Name, Month, Amount.
Therefore, Month is the pivot column, and Amount is the unpivot measure column.
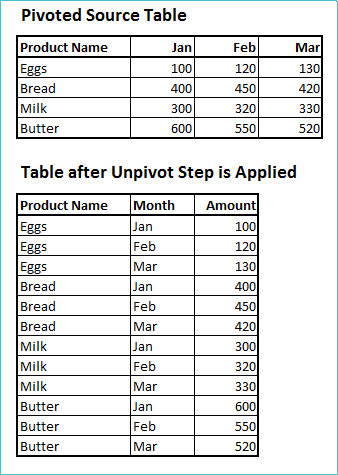
The month column shows entries for each month for each product.
Original column headings: Jan, Feb, Mar, etc., now appear as entries under the Month column in the unpivoted table.
Values for each month in the original table now show as values in the Amount column in the appropriate row as identified by the Product Name and Month column entries.
Using unpivot steps
Unpivot steps may be used to rotate input columns into row values. These steps allow you to transform information that resembles a pivot table in a spreadsheet into a relational form, suitable for combining with other pipelines in the model.
Note
To confirm that the rotation is correct, use a pipeline tab's Preview area as the step is being configured.
History step type
Adding a history step to your pipeline allows you to track changes in data model information over time. It allows you to take a "snapshot" of your data at different intervals (points in time) and see what has changed. This action is performed each time the pipeline is processed.
Important
If a column's data is being tracked, but the data changes more than once during pipeline processing, only the most recent change will be reflected in the column's history data, as changes are only determined when the model is processed.
History type options
The following History Type options are available:
Default (SCD 2) - This option leaves the history records in a format similar to Slowly Changing Dimension Type 2 (SCD2). Read more about Slowly changing dimensions The active duration of records can be reported on in this history type.
Snapshotting - Makes a copy of each record for each day the record is in effect. Even if there are no changes in a record, it will make a copy of the last record.
Advantage and disadvantages of this type:
Advantage: Analytic resource design is much more simple.
Disadvantage: The resulting pipeline can be many orders of magnitude larger than the source pipeline, which can have a large effect on processing times and warehouse size
Disadvantage: Some reporting tools do not support aggregating based only on the last value for a date (last-non-empty) as is required to make use of a snapshotting pipeline.
Disadvantage: By aggregating only the last value for a date, this history type is incapable of reporting on inter-day changes to measures.
Compensating. This option creates a compensating record that effectively "negates" the previous record. The current value for a measure can then be determined by a total-to-date calculation that is automatically generated in the history dimension in the cube.
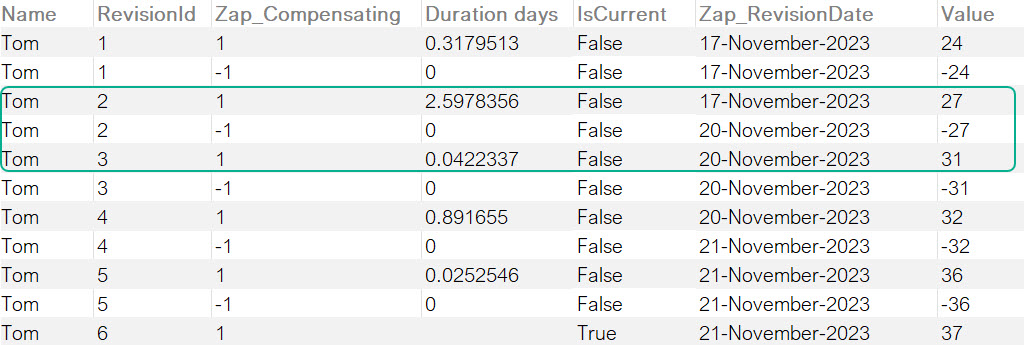
If there is no change in history, as seen above on 18 and 19 November, there is no effect to history.
If there is a change in history, as seen on 20 November, the last record on the 17th will be finalized (IsCurrent becomes false, and the active duration time is calculated). A compensating record is added to negate the tracked value in the previous record and a new "current" value is added.
Advantages and disadvantage of this type:
Advantage: The resulting pipeline has no more than twice the records of the original.
Advantage: This type can capture inter-day changes in history data.
Disadvantage: Some calculation is required at report time, which can affect report performance and increase the complexity of analytic resources.
History type restrictions
When using the History Type drop-down list, the following restrictions should be noted:
Snapshotting does not support duration and it is, by nature, add-only (i.e., needs periodic full load).
Since the warehouse will now contain data that is temporal in nature, and cannot be recovered from the source alone, it is highly recommended that on-premise instances institute a backup process for the warehouse history table. This table name can be found in the History Table Name text box.
Member properties are not supported against the key of a pipeline that contains a History step. As an alternative, the model designer can associate member properties (using the Property Of column property) with non-key columns.
When using incremental loading with your warehouse or cube, the Add Only option should not be used with the Compensating or Default (SCD 2) types, as the RevisionEnd column will not be updated correctly. Instead, you should only use the Add & Update incremental type. On the other hand, the Snapshotting type fully supports both the Add Only and Add & Update incremental types.
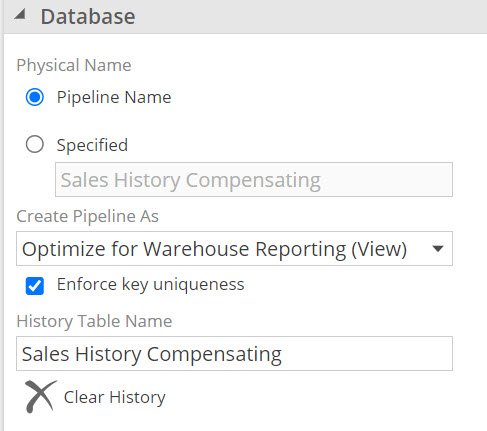
Clearing history data
You can use the Clear History button (in the Database area of the Pipeline panel) to clear the history for the current pipeline by deleting the corresponding history tab.
 |
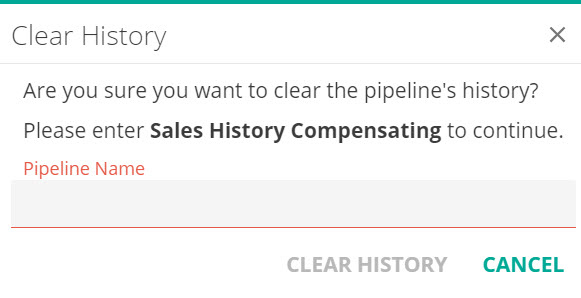
When the button is clicked, the Clear History screen appears, allowing you to confirm the removal of the history data by manually typing the pipeline's name and clicking Clear. This extra step allows you to avoid accidentally deleting the history or deleting the history from the wrong pipeline.
 |
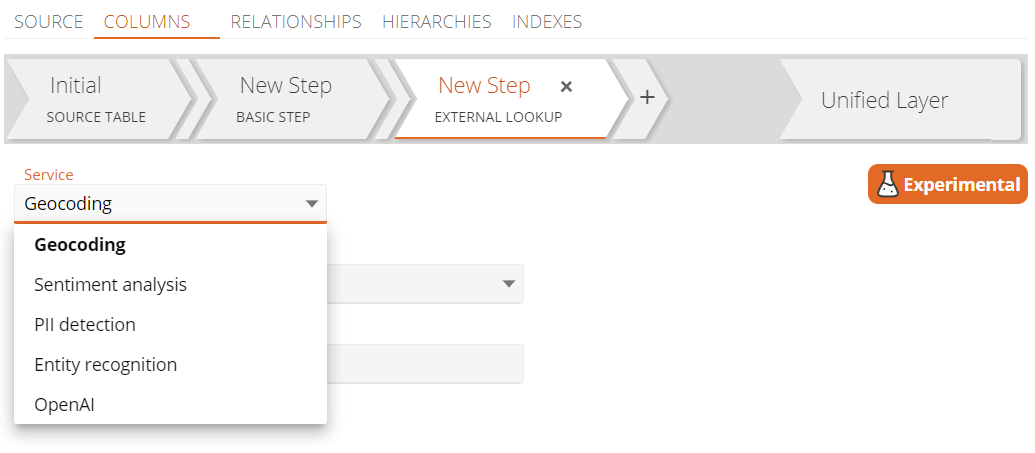
External Lookup Step
The external lookup step allows connecting to external services to enhance data. During processing, details will be looked up based on pipeline data, and configured parameters such as geocoordinates for addresses, or sentiment analysis for a phrase.
Important
For each service you will need to set up and manage external service resources, which Data Hub will connect to when making requests. Steps to setup the services are provided below for each lookup type.
Note
Data fetched from Azure services are cached, thus only changes and additions are refreshed. Like incremental load, this reduces load times, and also reduces Azure request costs.
 |
 |
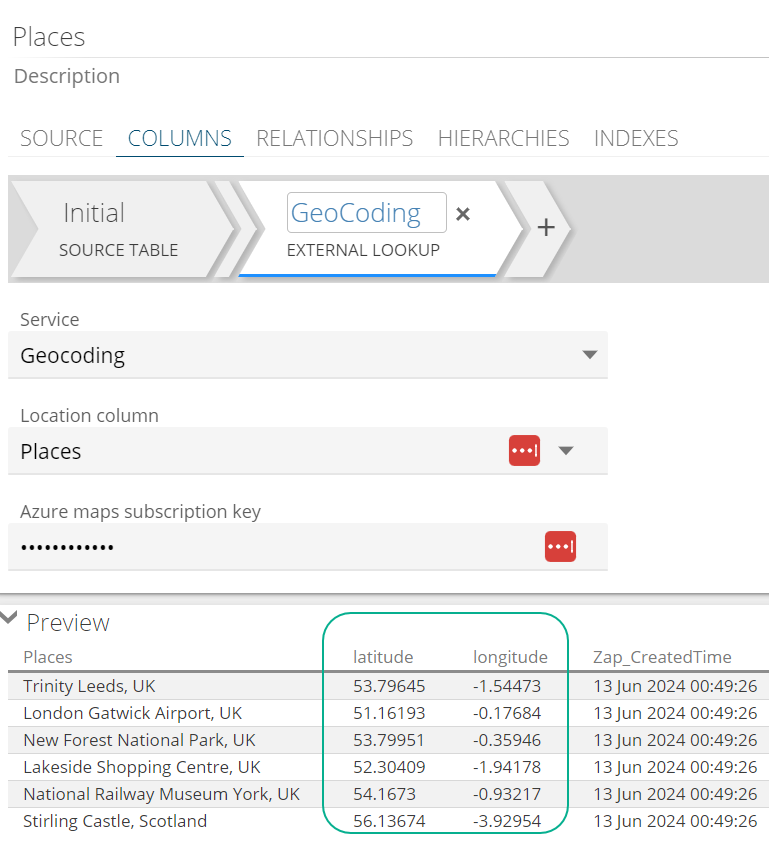
Geocoding
Geocoding provides coordinates for addresses, which enhances the ease of map chart creation significantly.
An Azure maps service with subscription key is required to connect to.
More information on Azure Maps
Note
Possible duplicate fields: The Geocoding step creates new columns for longitude and latitude to be populated with the results from the Azure map requests. In a case where the address source table you use for the geocoding step already contains these fields, it will result in duplicates. In this case simply delete the original fields from your source table.
 |
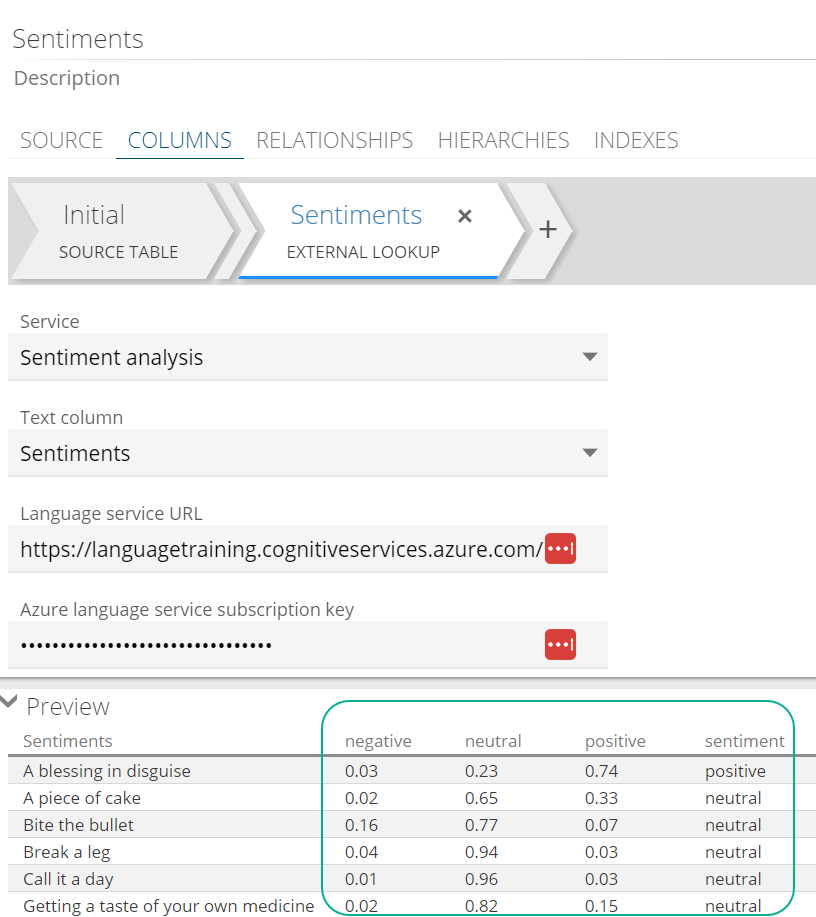
Sentiment Analysis
Sentiment analysis, is a technique used to analyze text to identify and categorize opinions expressed as positive, negative, or neutral. Sentiment analysis can be used in any business sectors, e.g. marketing and social sciences to gain insights into public opinion and customer satisfaction.
Example use case: Apply sentiment analysis to customer reviews, satisfaction feedback and support tickets, to create scores that can help prioritize urgency, responding to negative feedback promptly or gauge trends.
An Azure language service with subscription key is required to connect to.
More information on Sentiment Analysis
 |
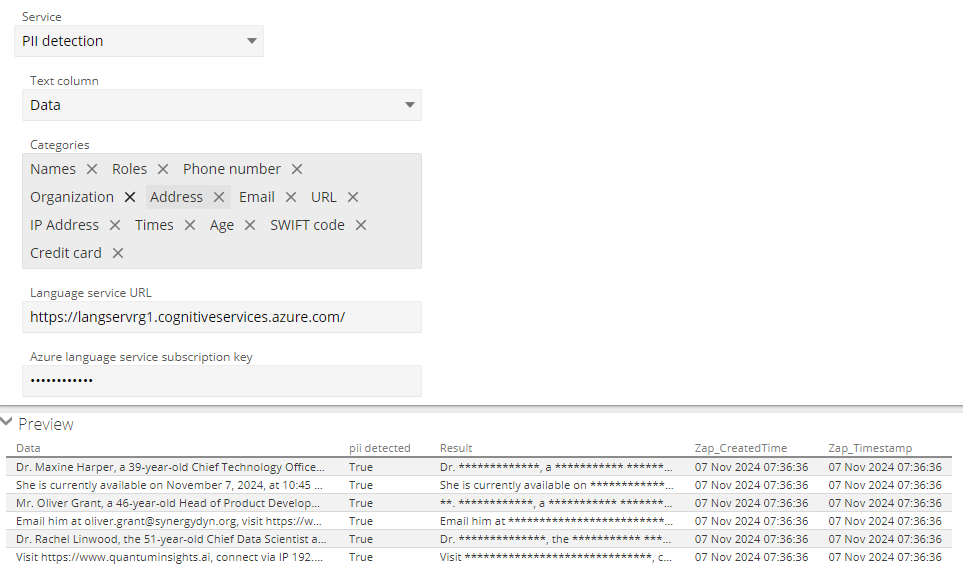
Personal Identifiable Information (PII) detection
Personal Identifiable Information (PII) detection service hides information from the input data. All PII can be redacted, or just specific categories.
An Azure language service is required to make this work.
Read more about the Personal Identifiable Information Language service
 |
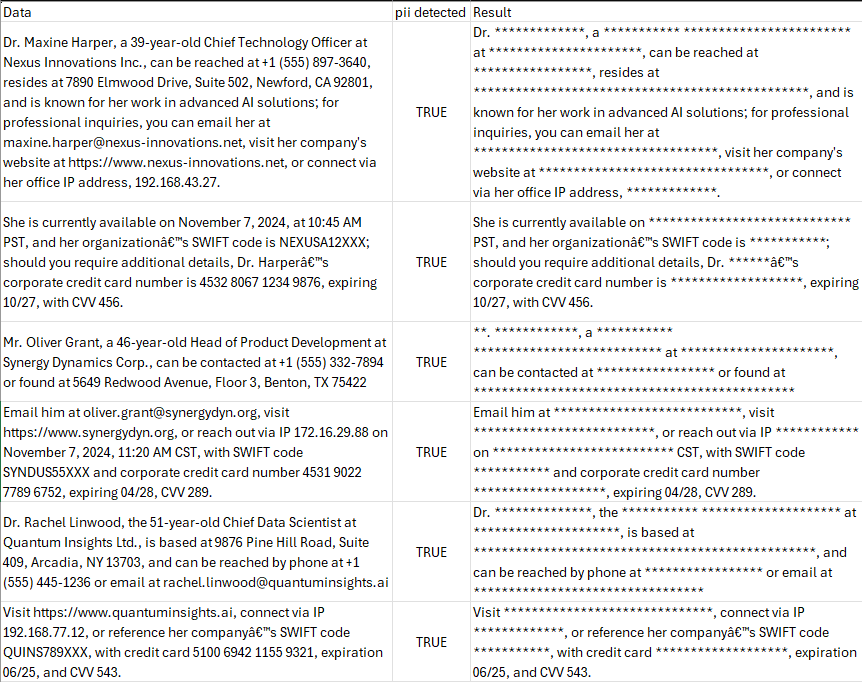 |
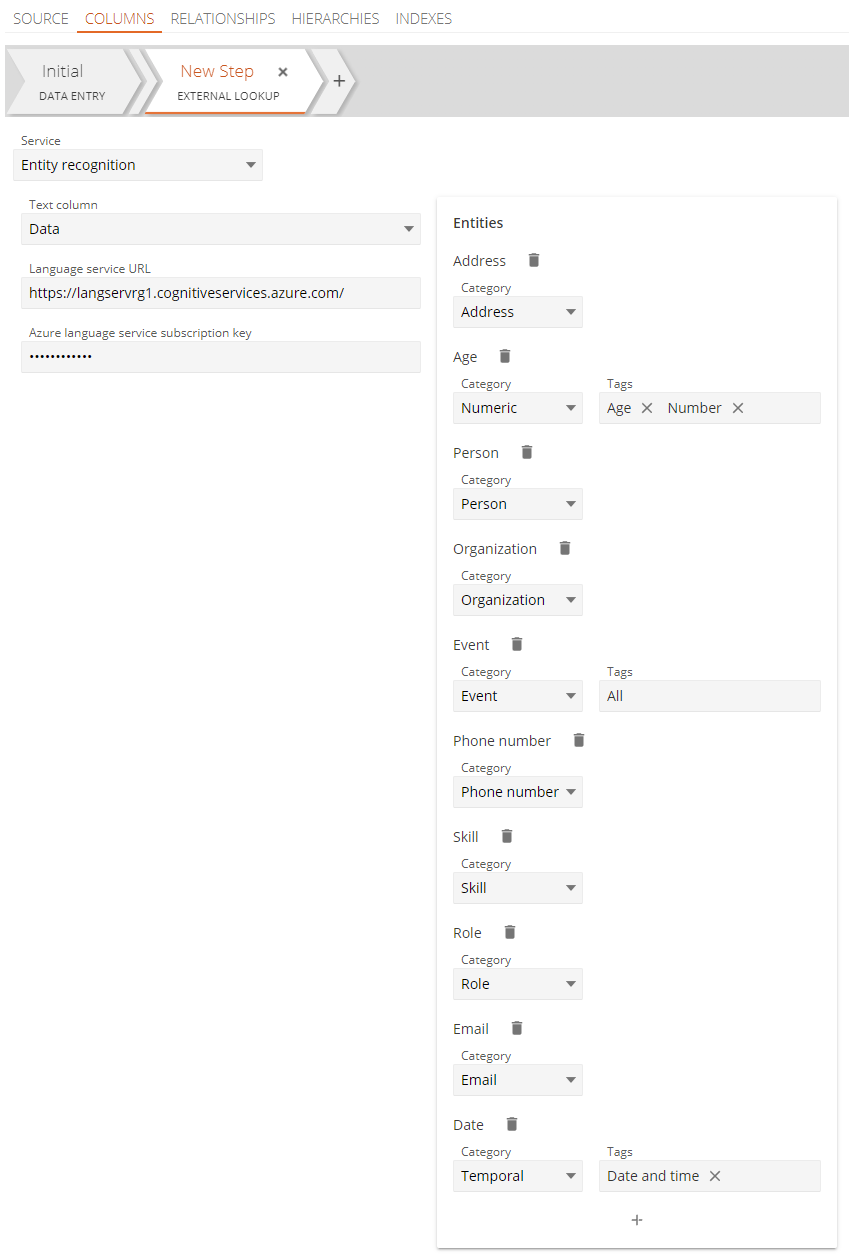
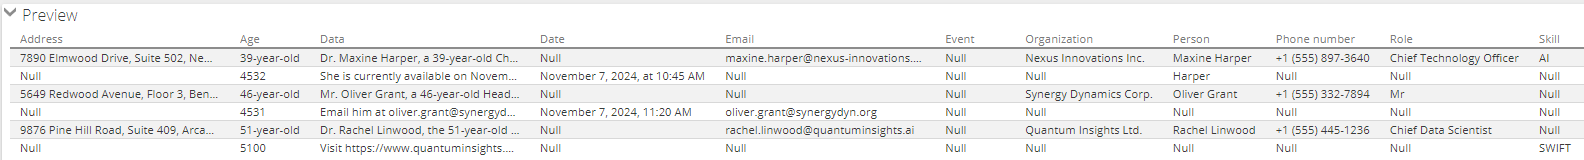
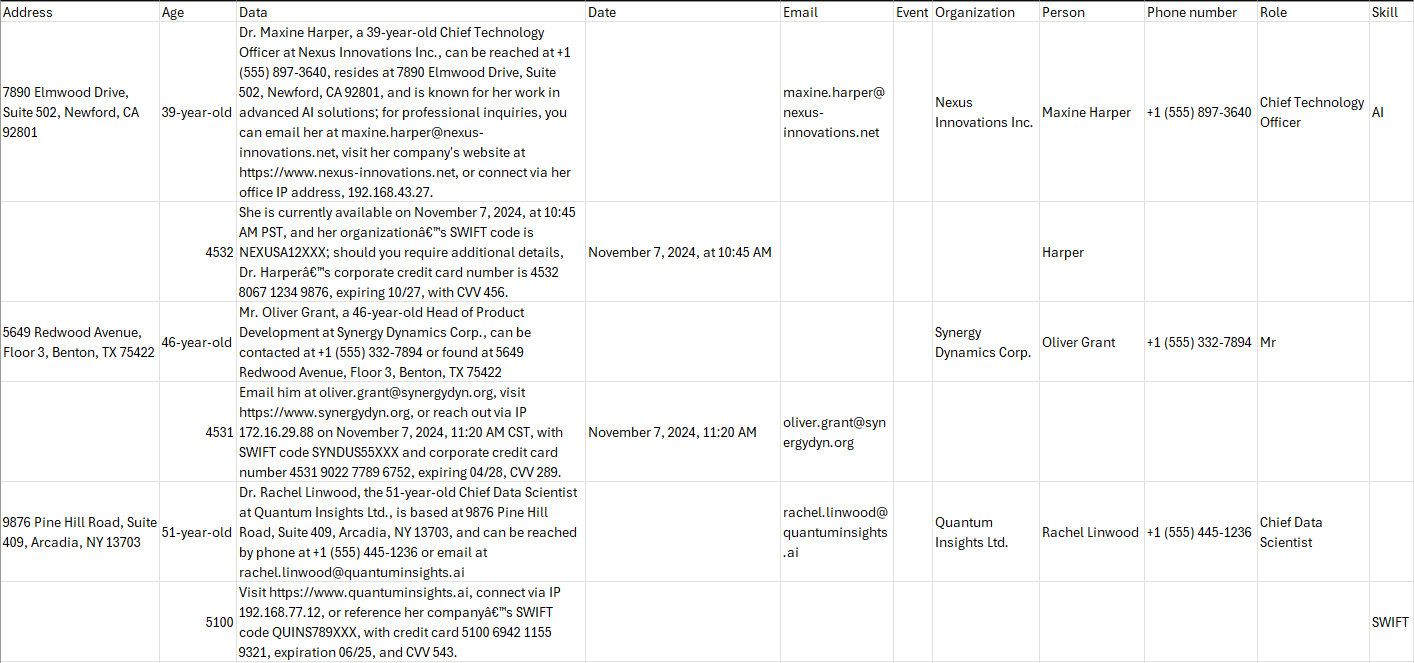
Entity recognition
Named Entity Recognition identifies and categorizes entities in provided text, for example places, people, organizations and quantities. Below is a sample result of Entity recognition service with some entities. Note that an Azure language service is required to make this work.
An Azure language service is required during configuration.
More information on Named Entity Recognition
 |
 |
 |
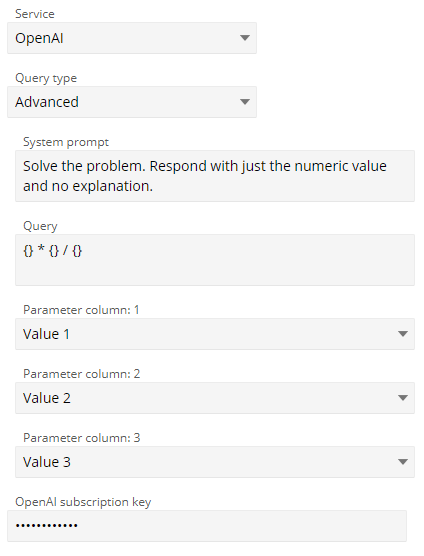
Open AI
OpenAI lets you turn your data into text prompts that get run against OpenAI's Large Language Model (LLM).
Some example uses would be:
Validating data (Does this transaction look correct?)
Categorization (Is this an internal or external customer?)
Customer prospecting (On a scale from 1 to 10, does this customer seem interested in the product?)
More information on Open AI
Two modes are available:
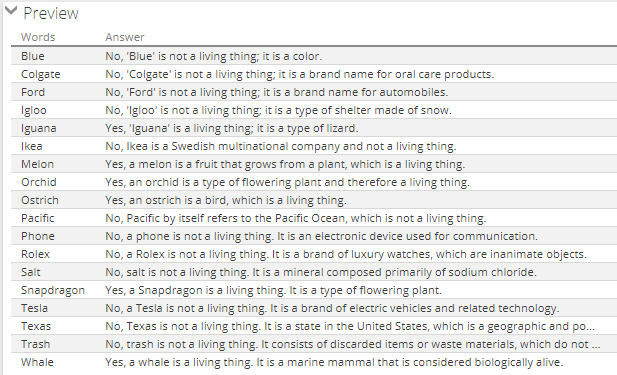
Simple: Allows you to ask simple questions about a column of data.
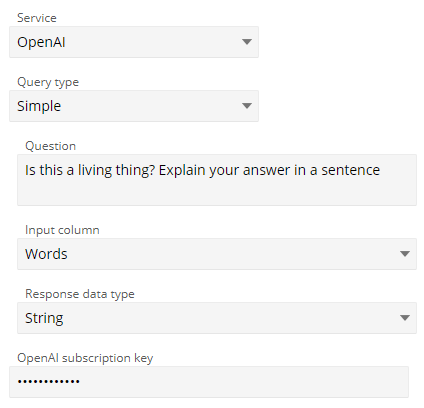
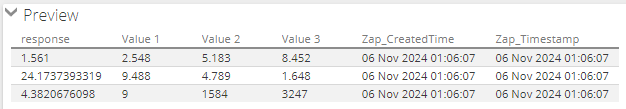
Advanced: Advanced lets you build text prompts that are run against the LLM. It has support for system prompts and prompt engineering.
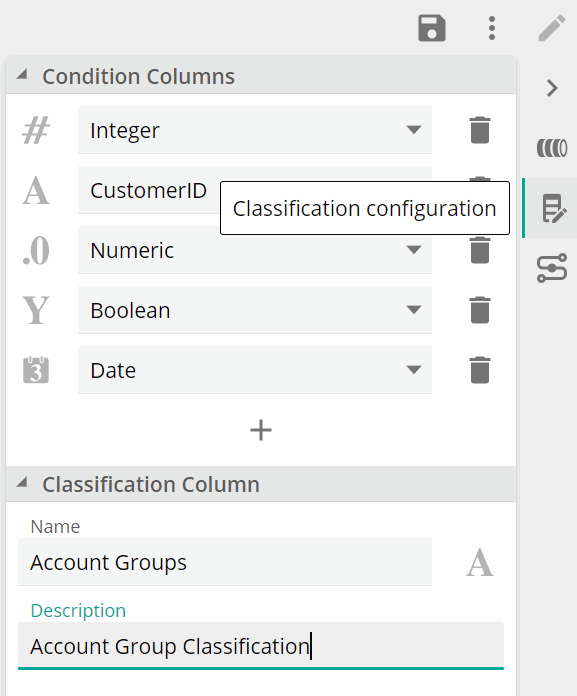
Classification Step
Classification enables categorization of data based on rules. Below, groups of accounts are classified based on the account categories they belong to.
 |
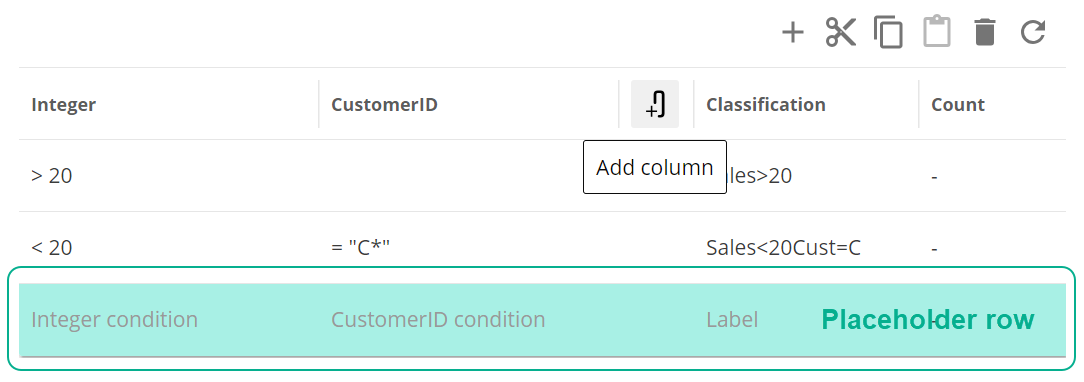
Add, remove and interact with rules in the rules grid.
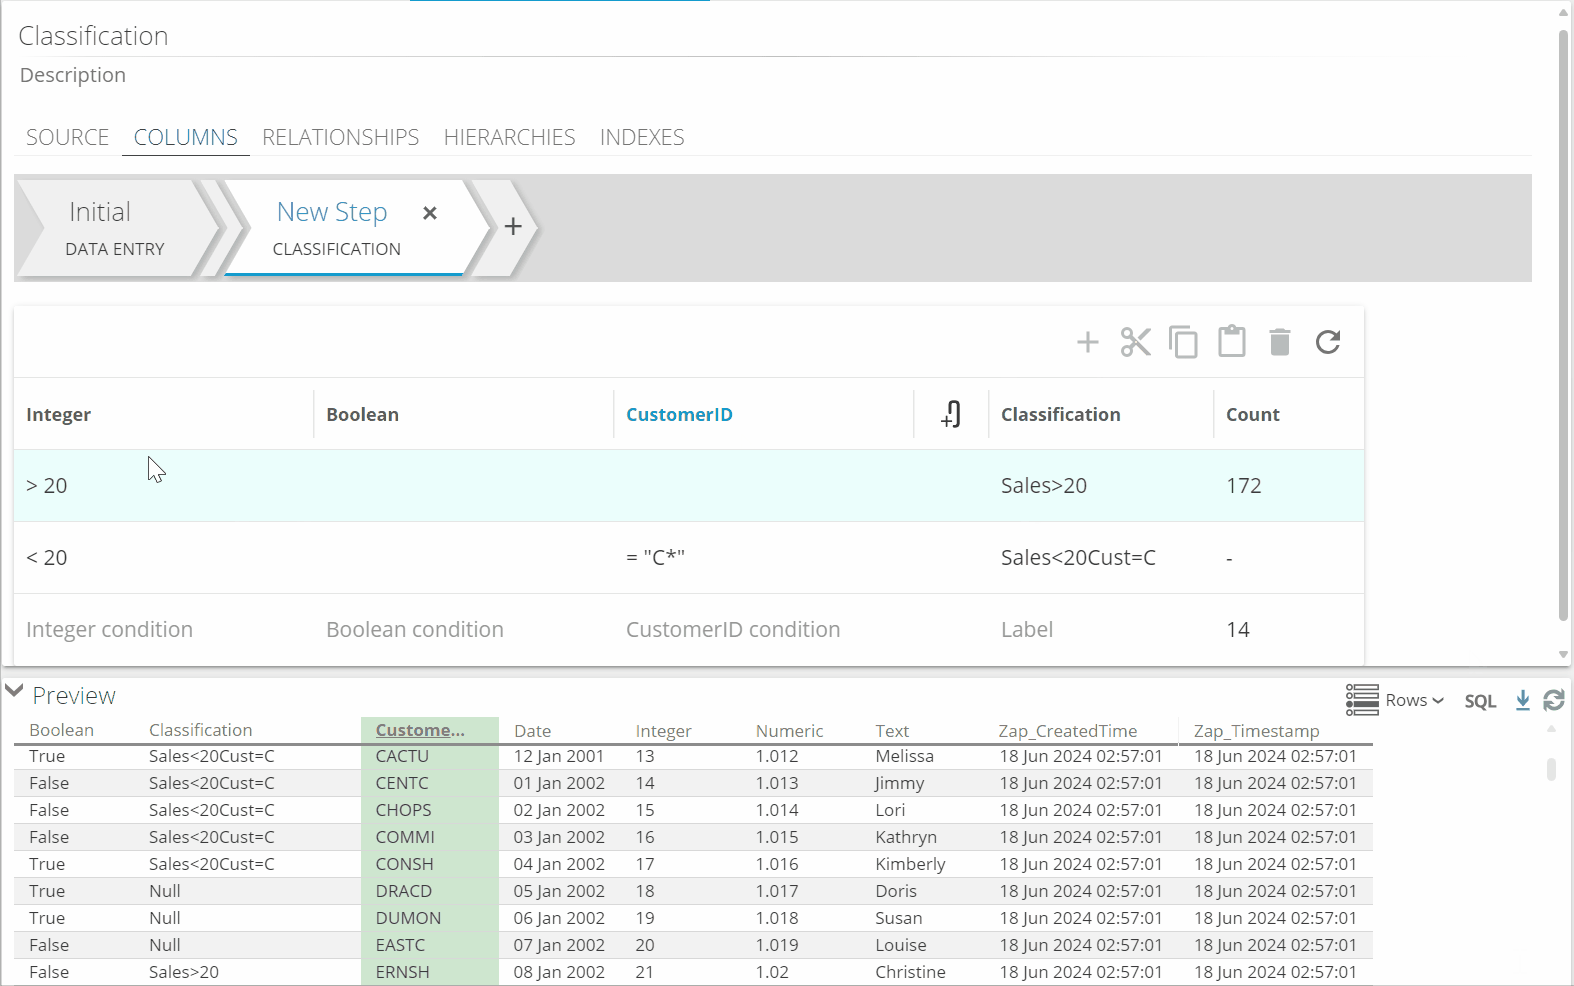
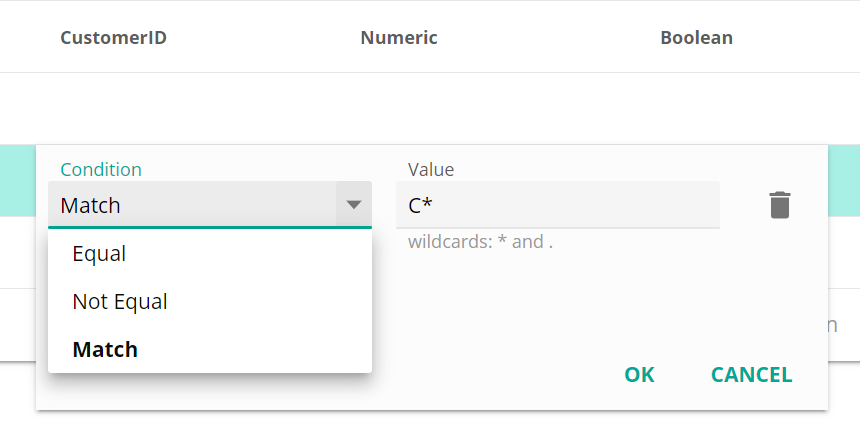
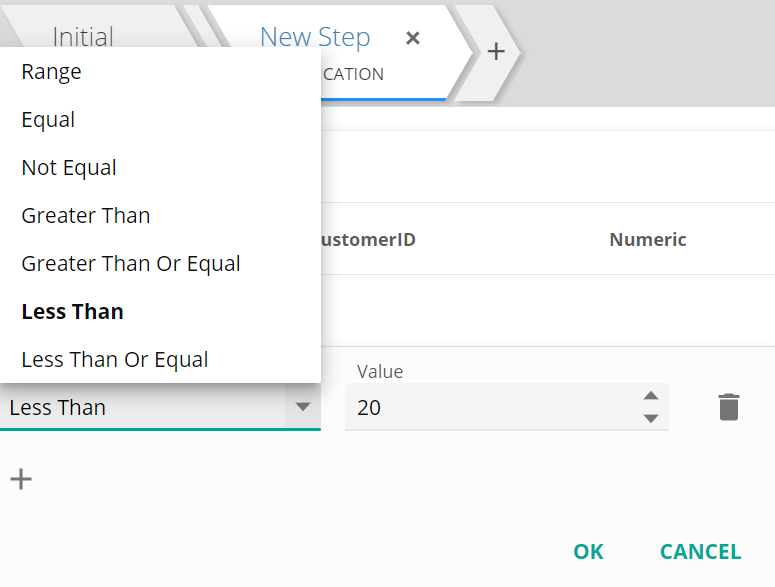
Specify conditions for rules. Conditions vary based on the column data types.
Add condition columns on the rules grid or in the Classification Configuration panel on the right.
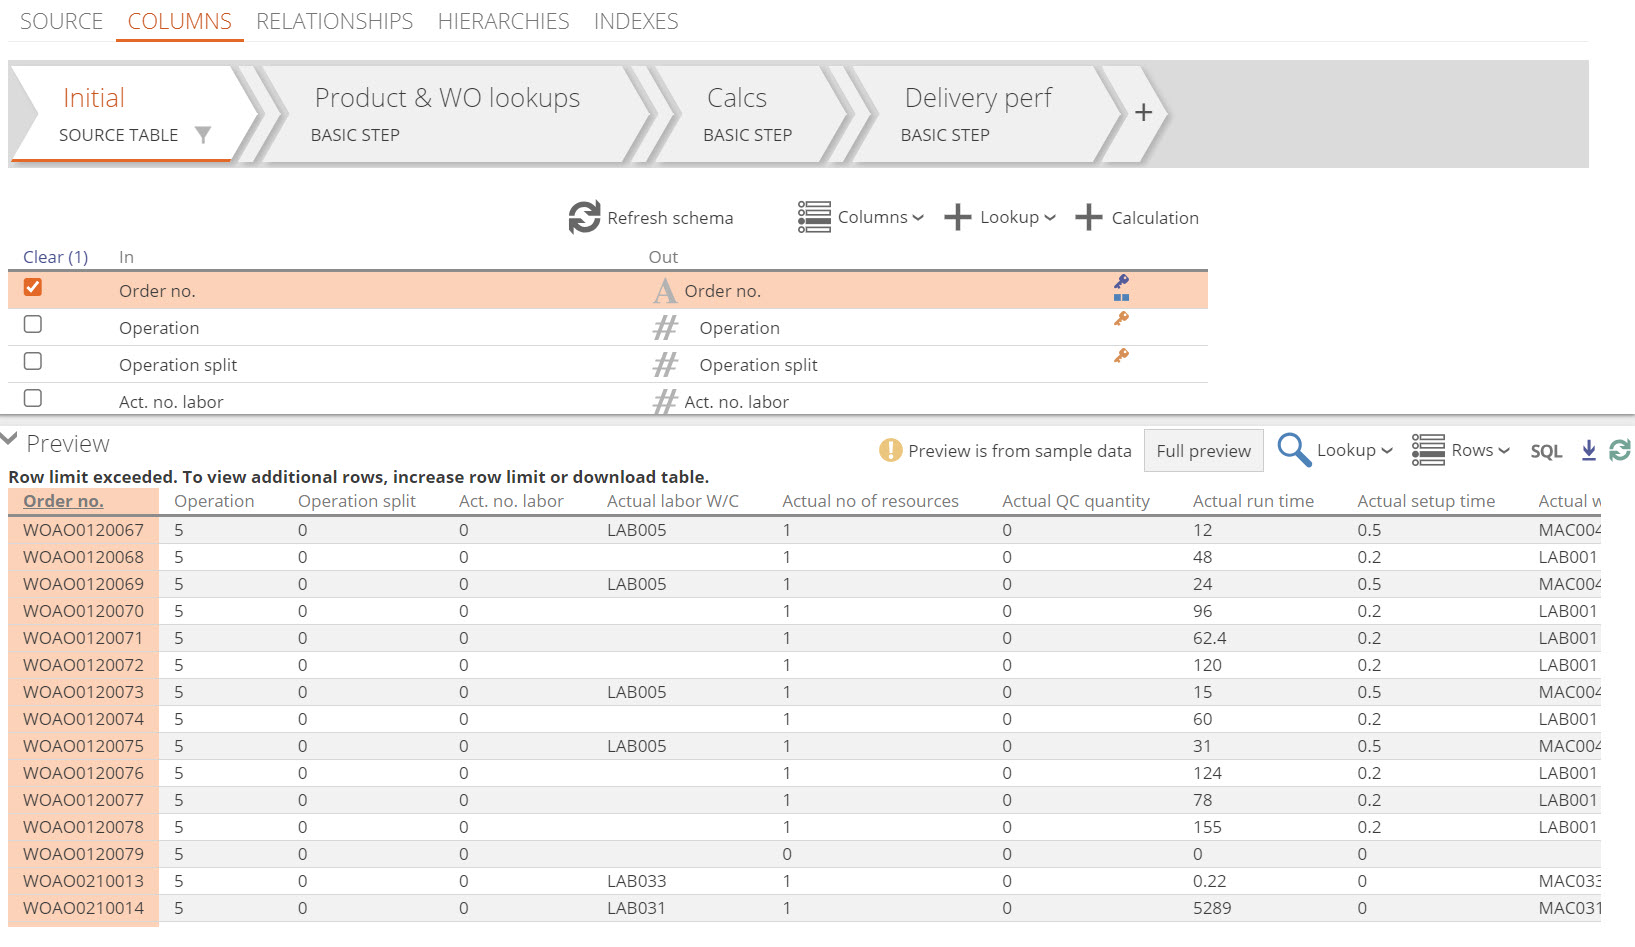
Step preview pane
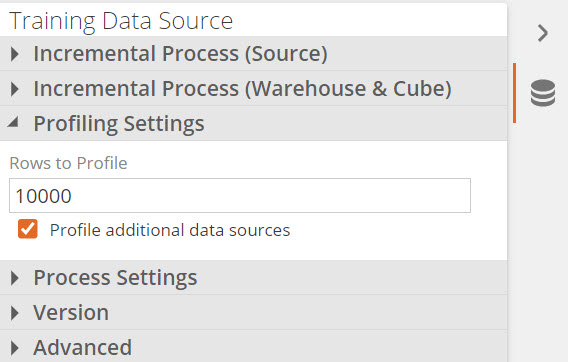
The COLUMNS pipeline tab includes a Preview area that displays the output data of the currently selected step in the pipeline. The default rows to show in the preview is 250. This can be changed up to the profiling limit (default of 10 000), which can be changed on the data source profiling settings section.
 |
 |
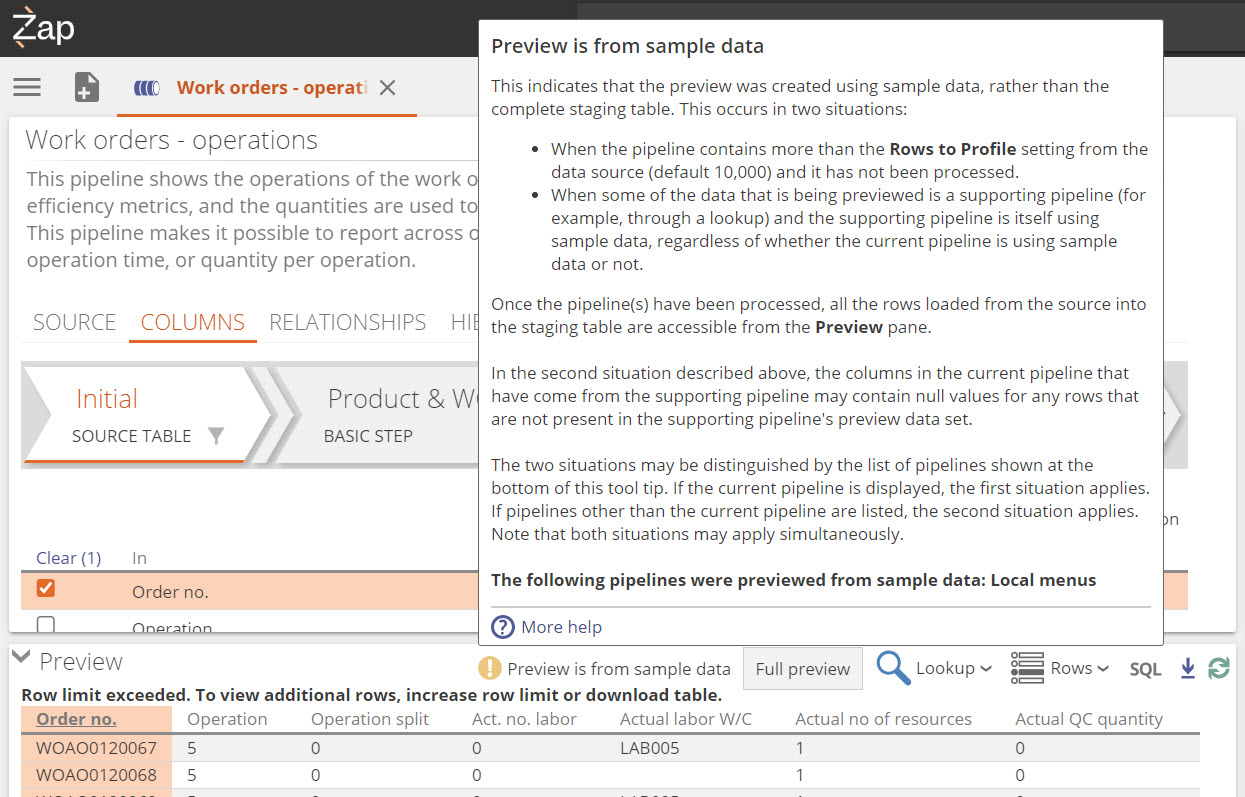
Sample data and full preview
If Data exceeds the number set in the profiling settings as shown above, Preview is from sample data will be displayed. When required, click Full preview to see a full data set in the preview.
 |
The following scenarios can cause this to happen:
When the currently viewed pipeline contains more rows than the number set in the profiling settings, and it has not been processed. The default profiling setting is 10,000.
A supporting pipeline used by the current pipeline is being previewed from sample data (e.g., in a lookup), regardless of the current pipeline's status.
Note
The columns in the current pipeline (which have come from the supporting pipeline) may contain null values for any rows that are not present in the supporting pipeline's preview data set.
The tooltip that can be seen when hovering over Preview is from sample data will list the pipelines that are being viewed from sample data. In the image below, the Work orders pipeline are being previewed, but Local menus are listed in the tooltip, which means the supporting pipeline Local menus has sample data.
 |
After processing, all rows loaded from the source into the staging table are visible in the Preview pane.
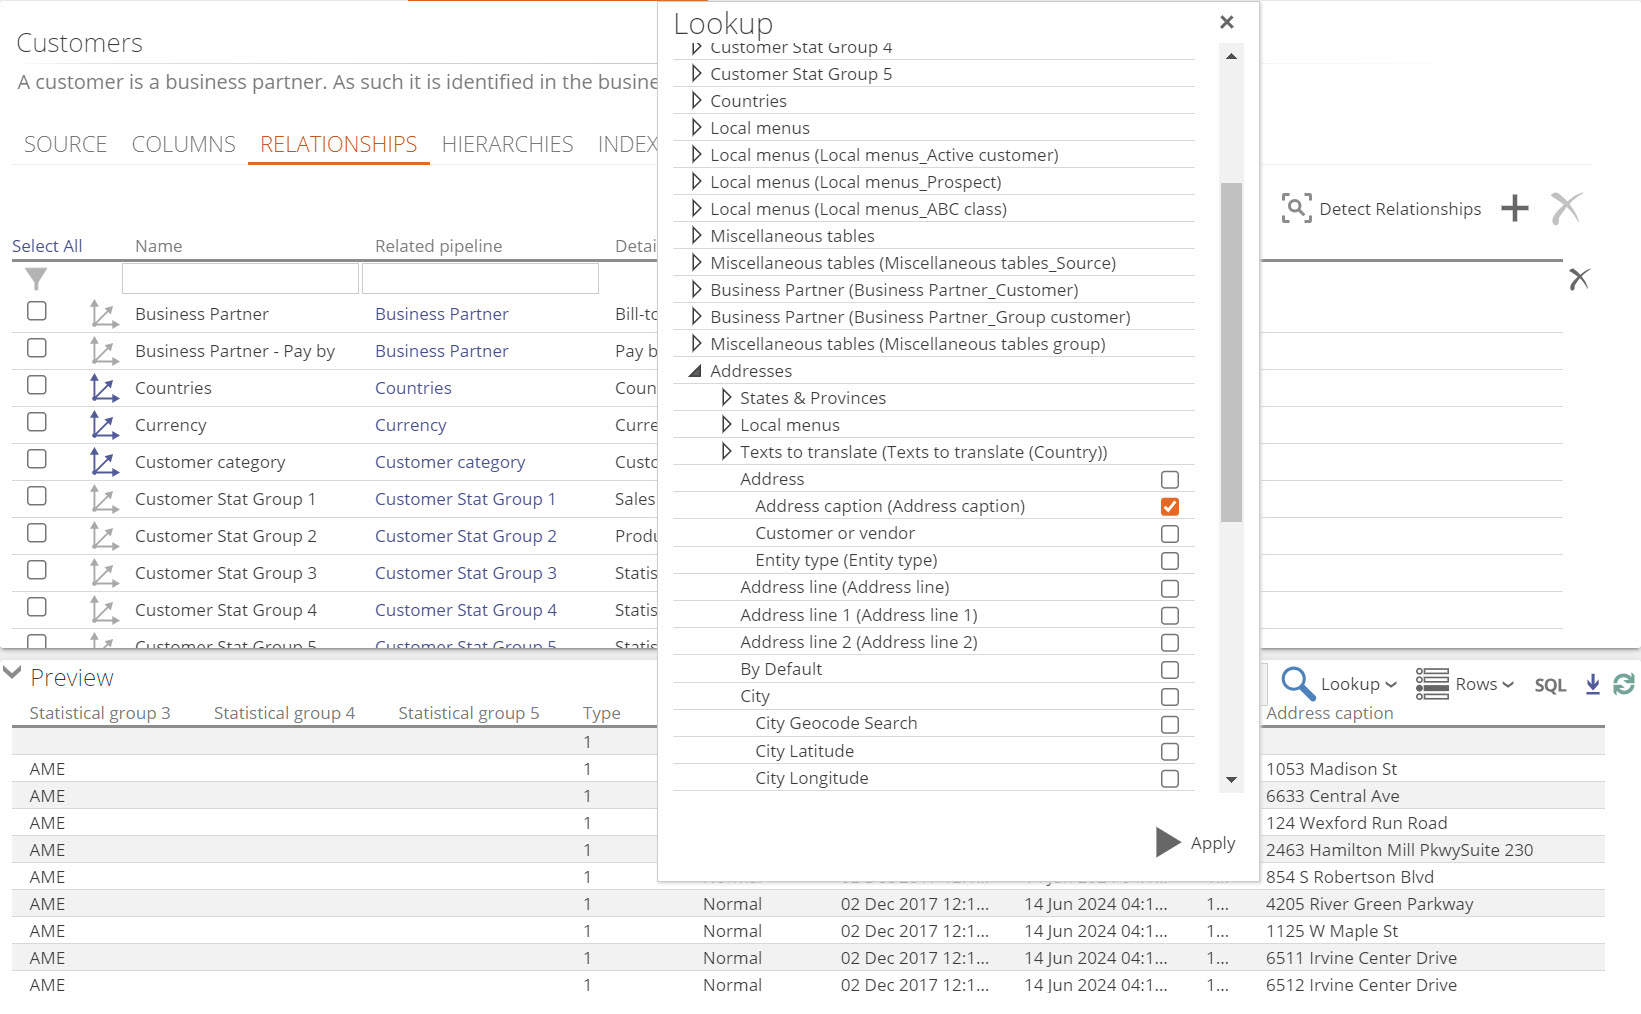
Lookup denormalized columns
At times there is a need to be able to view denormalized data. Denormalized columns available can be accessed via a lookup, which will then display in the preview. The available columns to lookup will depend on the relationships that is setup on the pipeline.
 |
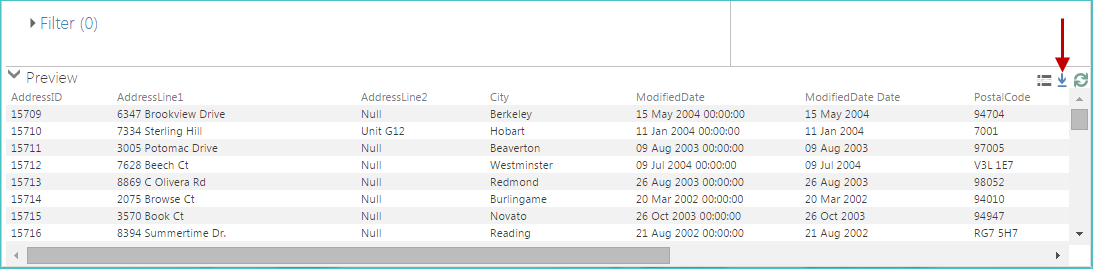
Download preview data
You can download the displayed data preview data (rows) using the Download preview button (highlighted below). The data is saved to your computer as a .CSV file.
 |
Important
Large pipelines may take a long time to download fully.
The downloaded .CSV file is packaged as a .ZIP file to allow for fast and efficient downloading.
If the sample data icon appears in the top right corner of the Preview pane, the preview contains only a sample of the table's data (typically only 10,000 rows). Otherwise, the specified number of rows that will be downloaded can be determined using one of the following methods:
Examine the staging rows entry in the pipeline's General properties area.
Examine the Rows to Profiles setting in the corresponding data source's Properties pane.
Refresh preview data
Changes to the pipeline settings (such as calculated columns, lookups, filters, etc.) will be automatically reflected in the Preview pane. However, changes in the source data are not automatically displayed.
In this scenario, use the Refresh button to verify the accuracy of the displayed data. You can also use this button if you are unsure if the displayed data is accurate.
Note
The button itself spins while the refresh is being processed.
If the Preview pane displays an error message, you can correct the error and click the Refresh button to display the preview data properly.
Appendix
Ordering of lookup, calculate and filter tasks on a step
The Basic step is the default step type and the simplest of all the available steps. It provides the most common settings for configuring columns in a pipeline.
All other step types include the features of the Basic step, along with additional features. Other step types perform their specific actions before the tasks below are performed. For example, a SQL step executes its SQL before any lookups, or calculated columns are created.
The following tasks are performed within a Basic step, in the order listed:
Adjust columns by:
Renaming columns.
Setting key columns.
Setting key columns.
Adding settings for reporting (such as whether each column is a measure or a dimension).
Add lookup columns for using data from related pipelines.
Add calculated columns.
Delete columns.
Filter rows.
Note
If these actions need to occur in a different order, you must perform the second action in a subsequent step.
The following common scenarios will require the second action to be performed in a subsequent step:
Creating a calculated column then using it as a lookup column.
Deleting a column and then using it in a filter.
In the following common scenarios, both actions may be performed in the same step:
Creating a lookup column, then using it as the basis for a calculated column.
Using a column in a calculation or lookup and then deleting it.
Comparison operators implementation in the warehouse
The operators are implemented using T-SQL operators or functions. To understand the precise behavior of these operators, consult the following T-SQL documentation:
The Equal, Greater than, Greater than or equal, Less than, and Less than or equal operators are documented on the following website: http://msdn.microsoft.com/en-us/library/ms188074.aspx
The Contains, Starts with, and Ends with operators use the SQL LIKE operator with appropriate wild cards (see http://msdn.microsoft.com/en-us/library/ms179859.aspx for details).
The Is null operator uses the SQL ISNULL function (see http://msdn.microsoft.com/en-us/library/ms184325.aspx for details).
The Is empty text operator explicitly compares the value against an empty string ('').
The Is any of operator uses the SQL IN operator (see http://msdn.microsoft.com/en-us/library/ms177682.aspx for details).
Azure Service Configuration
For some steps, Azure services need to be configured to work.
Configure an Azure maps account
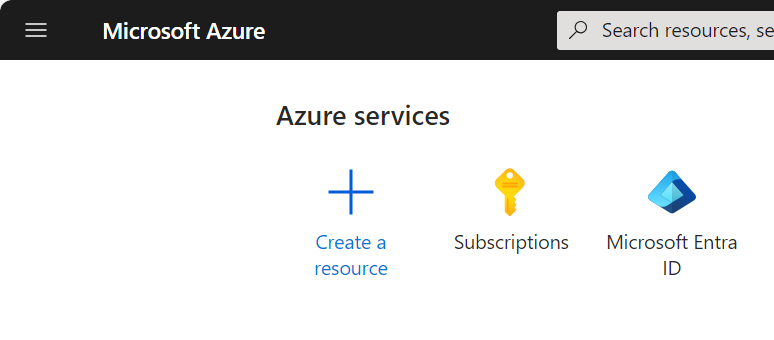
In Azure, click on Create a resource
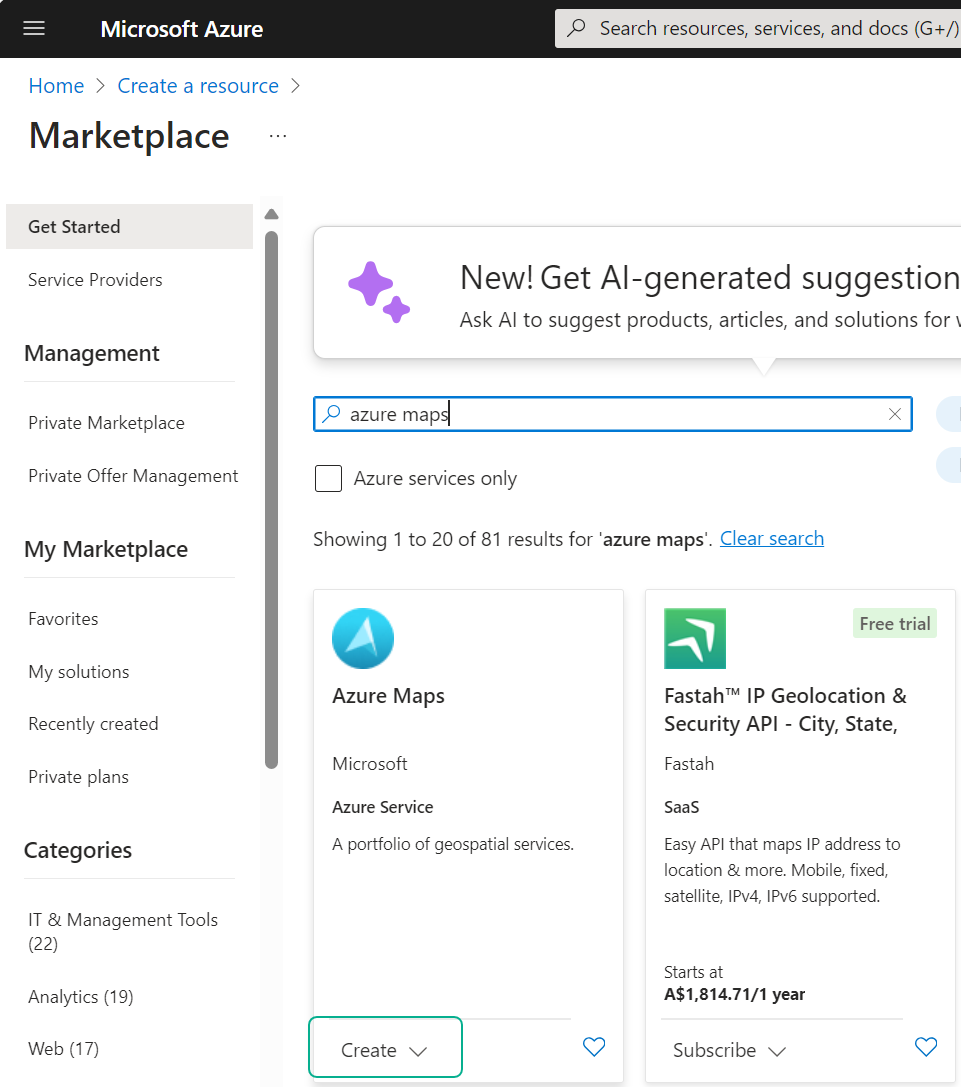
Search for Azure Maps.... and click Create
Provide required information on the Basics tab. Remember to accept the terms. To use all default values for the service account, click Review + create. Should you wish to change any default values, step through the wizard and make the required changes.
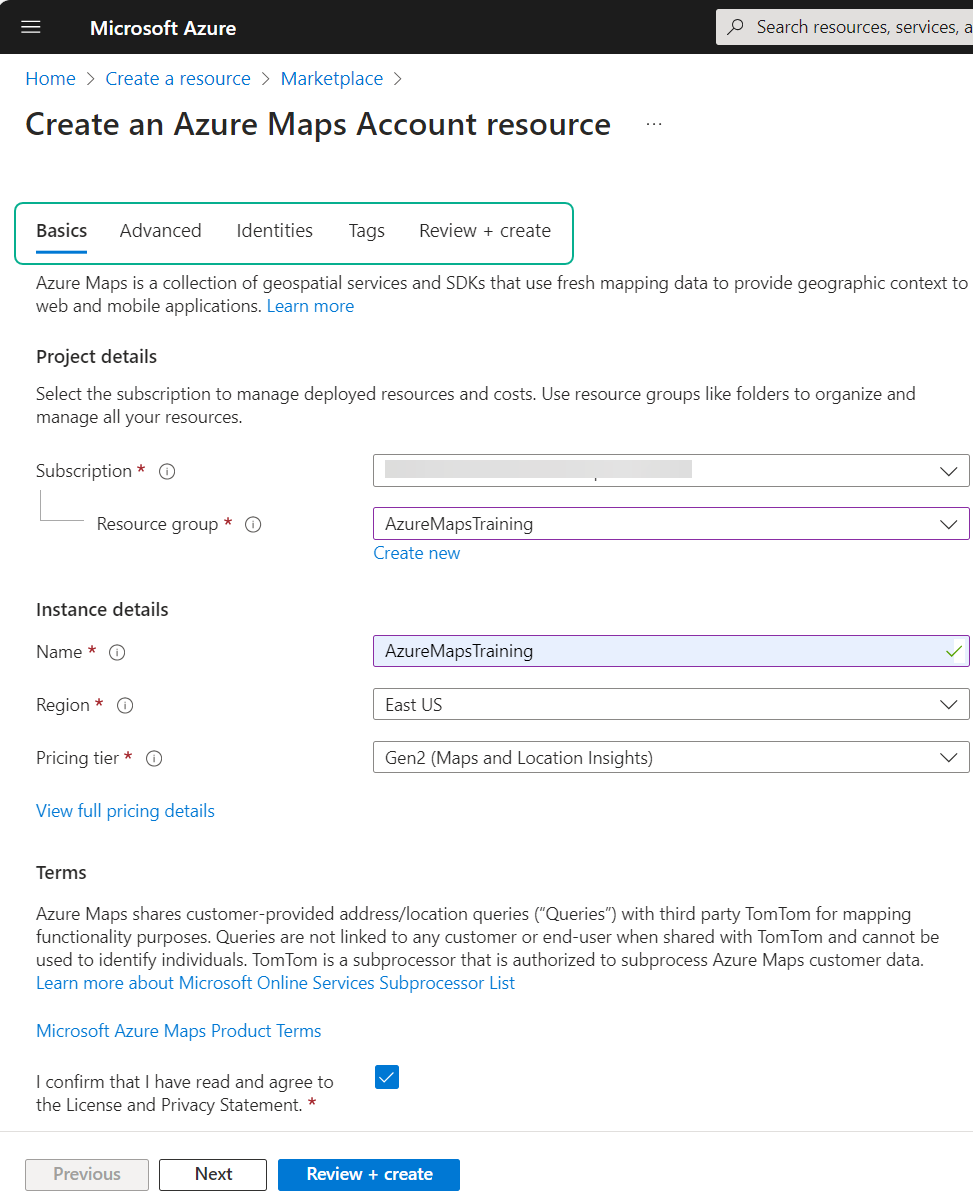
Important: Once you click Review + create, a review screen will be shown and you have to click Create again.
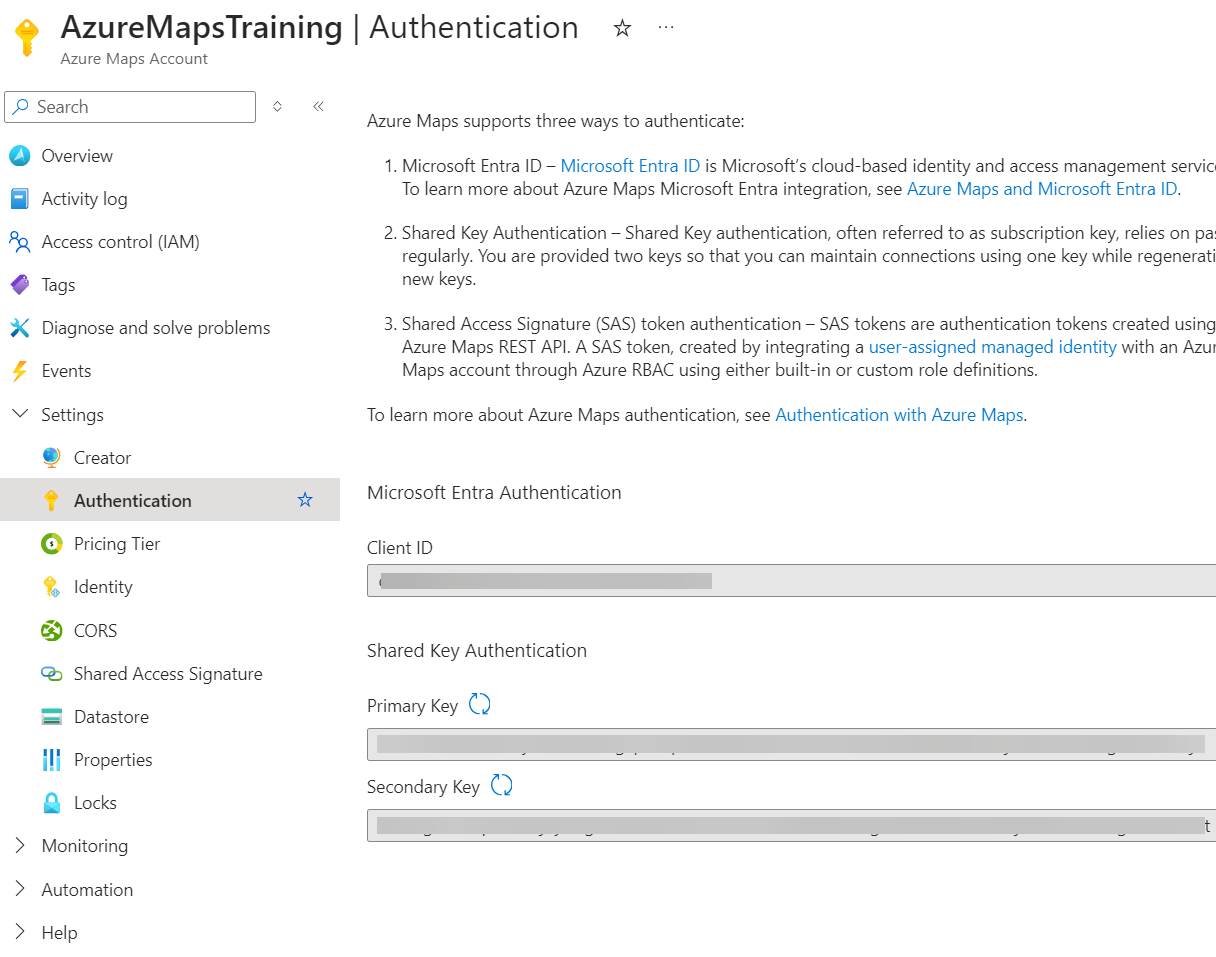
A deployment screen will appear, and once deployment is complete you can goto Authentication and copy and save your Primary Key for authentication later in Data Hub.
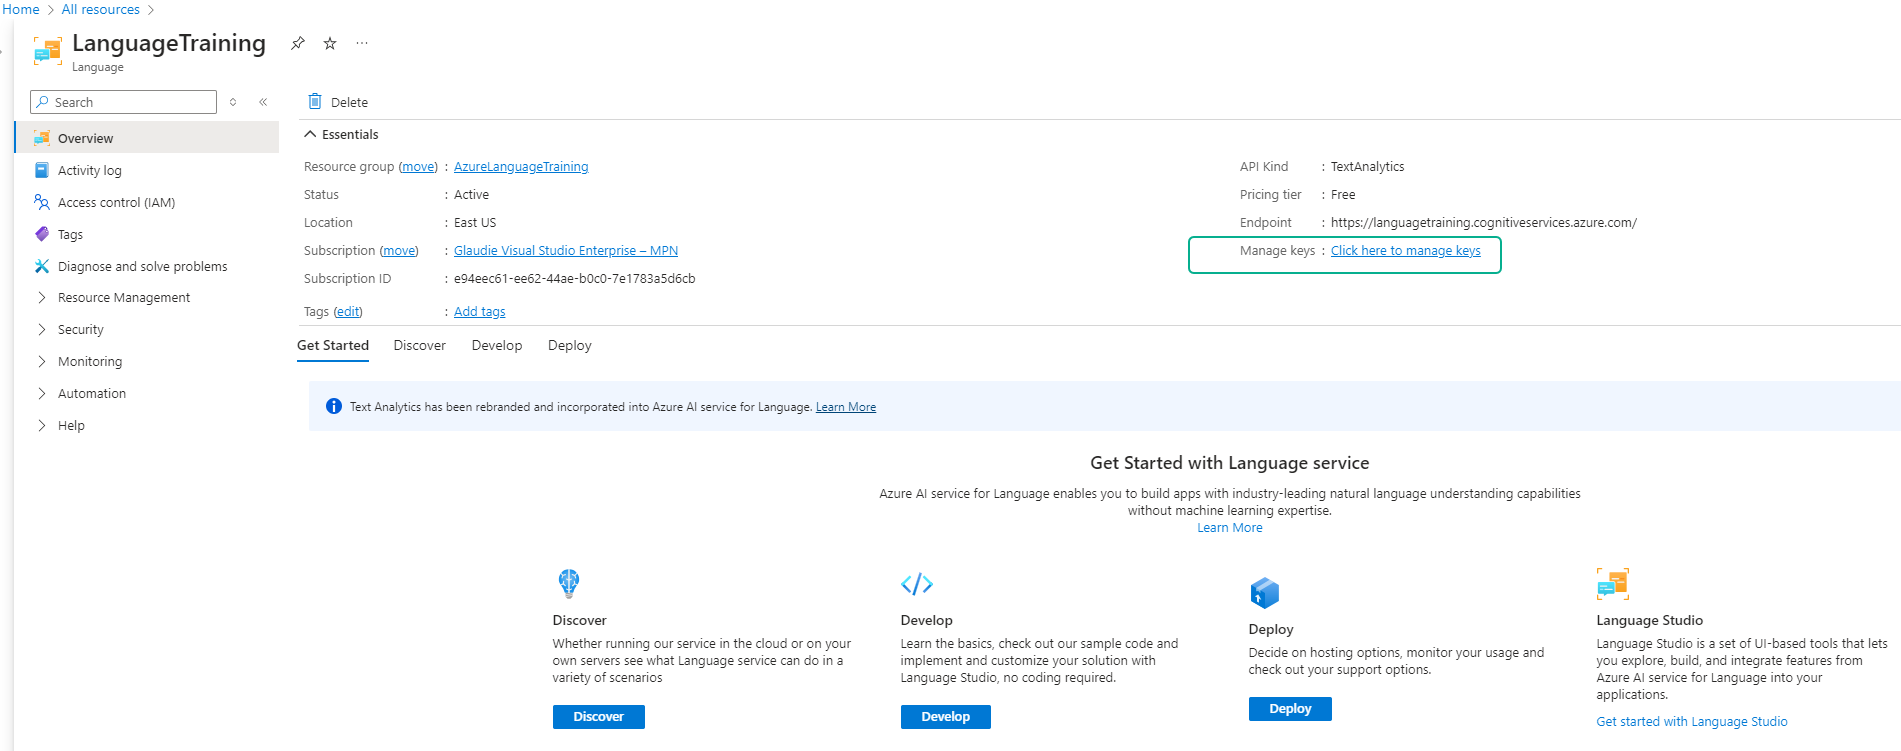
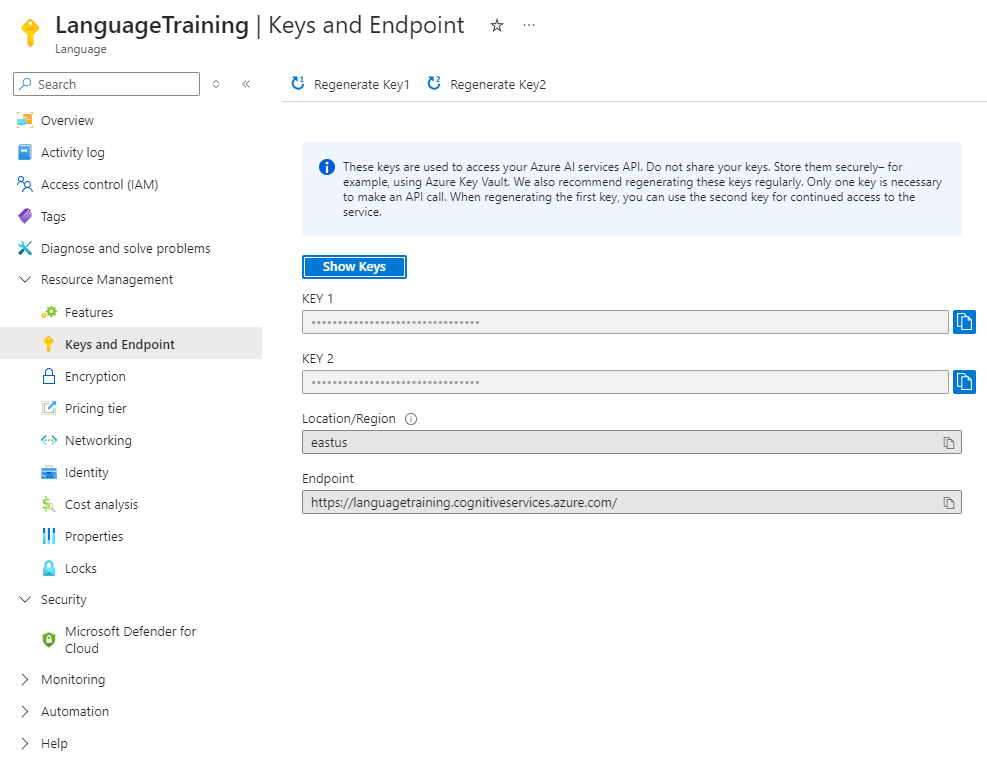
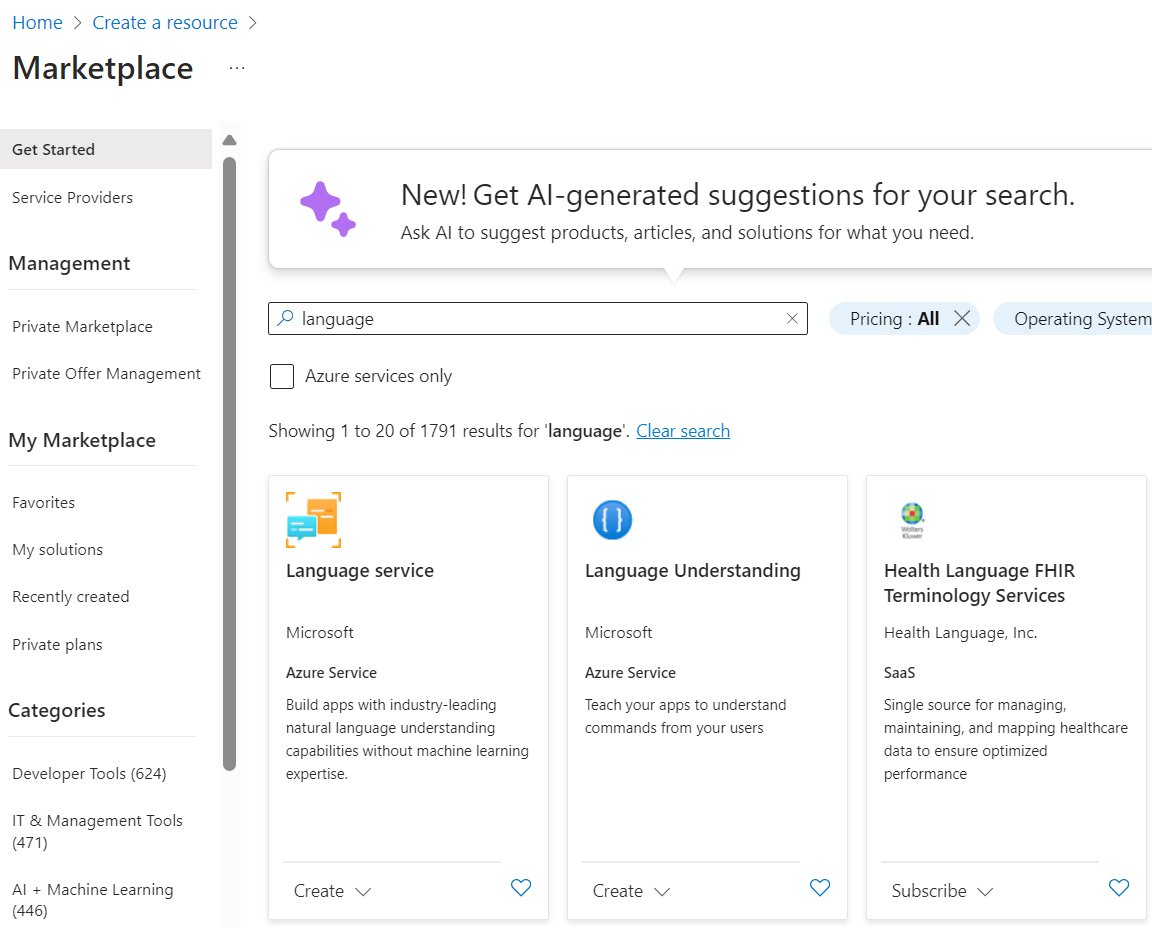
Configure an Azure language service
In Azure, click on Create a resource
Search for Language service.... and click Create
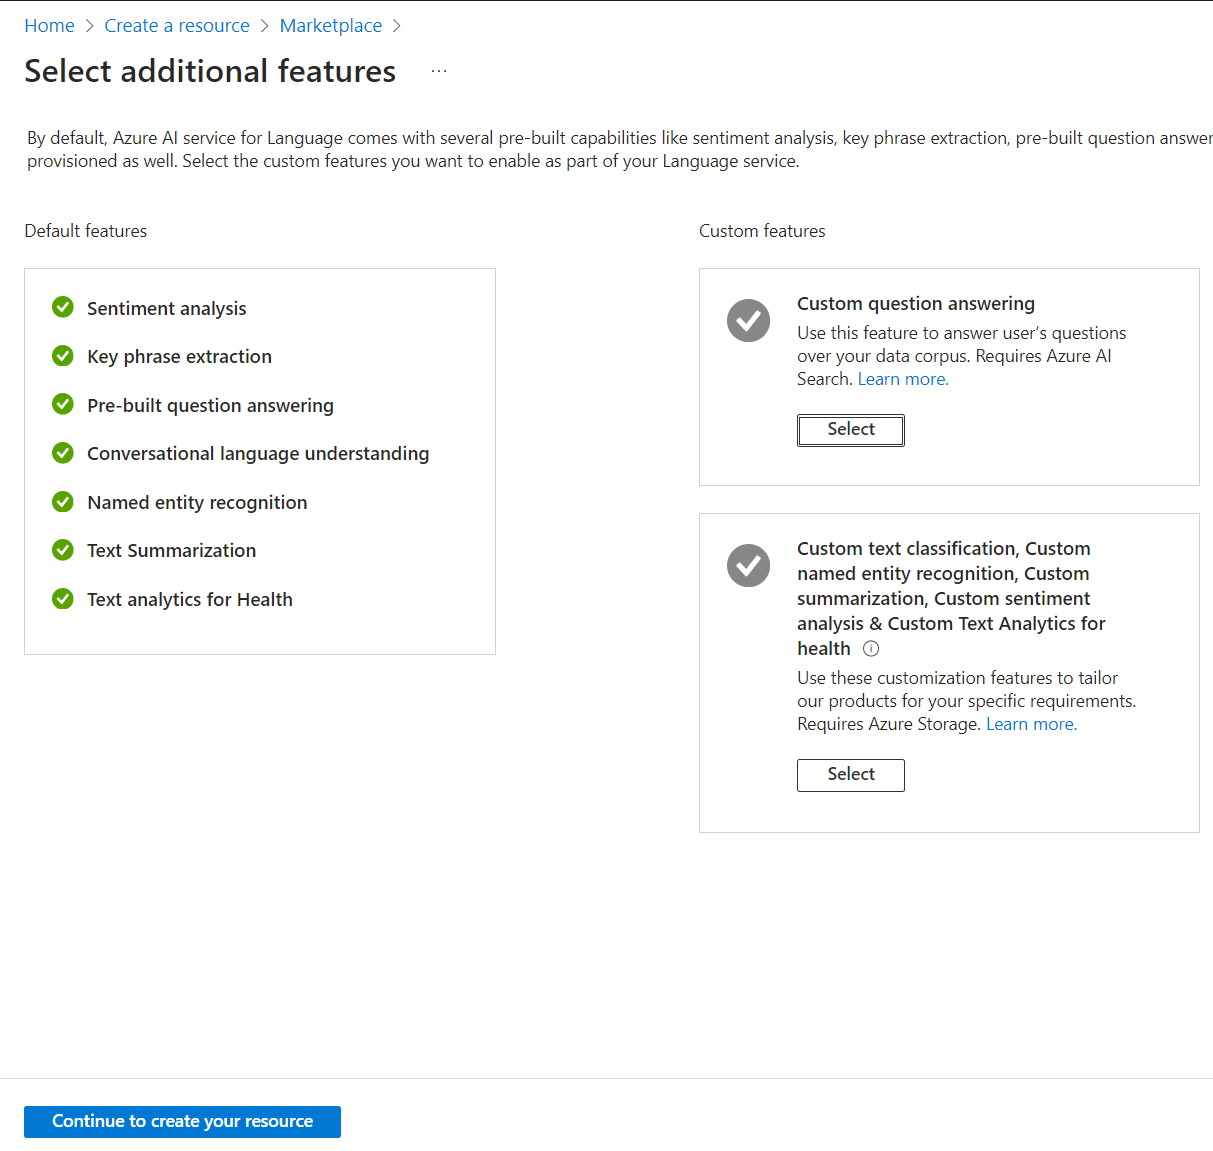
On the initial screen review and make required changes to features, but default values are sufficient for sentiment analysis to work.
Provide required information on the Basics tab. Remember to accept the terms. To use all default values for the service account, click Review + create. Should you wish to change any default values, step through the wizard and make the required changes.
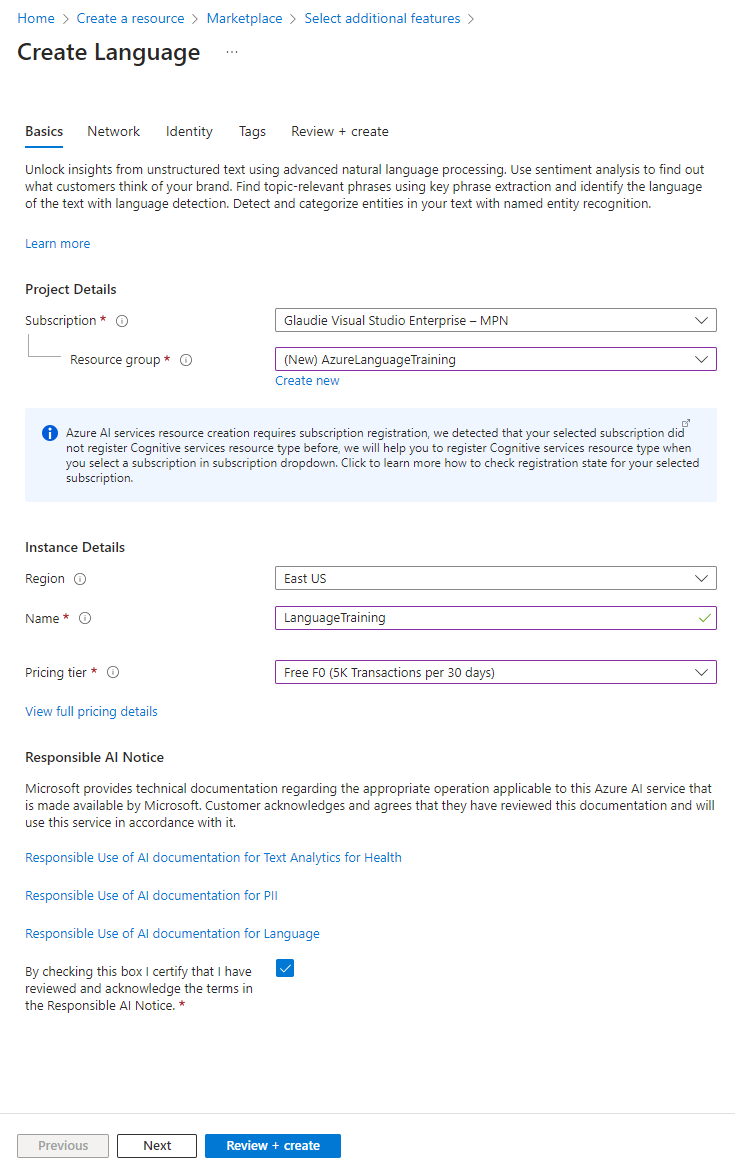
Important: Once you click Review + create, a review screen will be shown and you have to click Create again.
A deployment screen will appear, and once deployment is complete you can goto Manage Keys and copy and save your Key and Endpoint for authentication later in Data Hub.