Transform your Data with Steps
A Step is a pipeline setting that configures the transformations to be applied to column(s) in the pipeline. Each step can have a different purpose and correlates to a set of nest views within the warehouse.
Typically, steps can be added to either segment a transformation for a logical grouping, such as calculations, or because the step, like an aggregation, needs to be separated.
Steps are sequential, i.e., only data that fits a previous step will be available for the next step. For example, if you have filtered out all sales representatives from region 1 in a basic step, their data will not be available when you add an aggregate step next.
It is a best practice to consolidate steps where possible.
Add a step
Note
Each pipeline contains an Initial step and may have up to five additional steps added to it. In the unlikely event that you need more than six steps in a pipeline, you can create a new warehouse pipeline that uses the original pipeline as its source – giving you a further six steps.
Open the pipeline you want to add the step to.
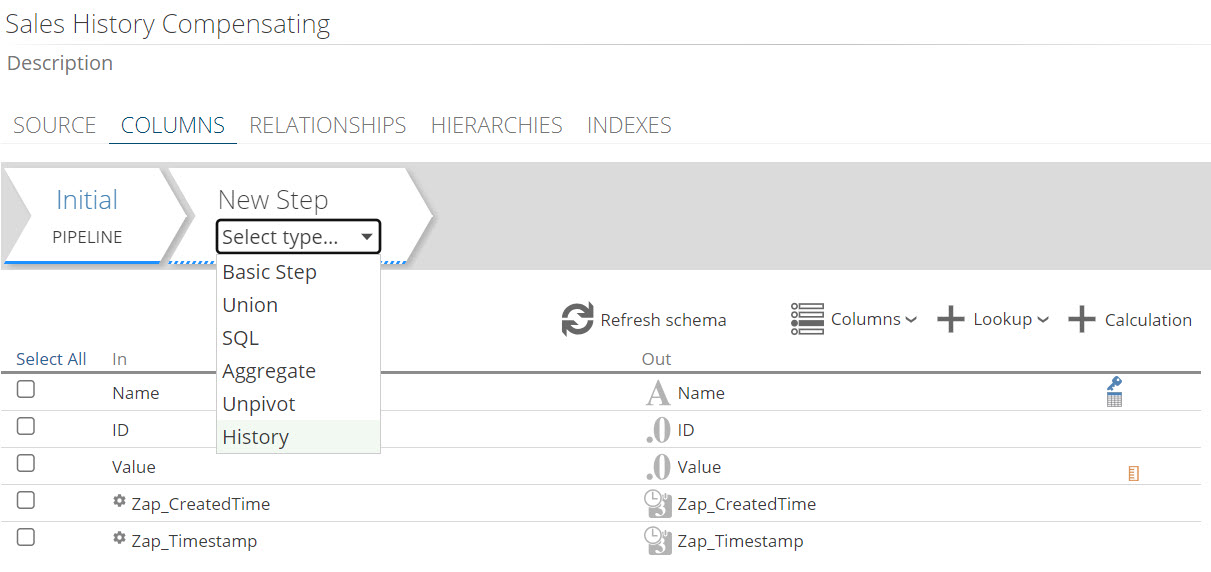
Click + to the right of the Initial step.
Select the type of step you want to add from the drop-down.
Click in the New Step text field to rename your step.
See below for configuring steps.
Configure a step
Initial step
The Initial step is automatically created in your pipeline and provides the most common settings for configuring columns in a pipeline.
On the Initial step, you can:
Adjust columns by:
Renaming columns.
Setting key columns.
Assigning data types.
Adding settings for reporting.
Add lookup columns for using data from related pipelines.
Add calculated columns.
Delete columns.
Filter rows.
Basic step
The Basic step is the default step type and the simplest of all the available steps.
In a Basic step, you can:
Add calculated columns.
Add lookup columns for using data from related pipelines.
Filter rows.
Aggregate step
An aggregate step lets you summarize the rows in a pipeline using the SQL GROUP BY clause. You can select which grouping operator to apply to each column and use preset templates to implement aggregations that ignore duplicates or summarize duplicates quickly.
Note
While you can manually apply aggregation operators to each column, pre-set templates make it easy to apply the common types of aggregation to a pipeline.
Select Aggregate step type.
Choose a template to apply using the Template drop-down:
Default template - summarizes the table based on the values of its attribute columns.
Ignore Duplicates template - removes rows containing duplicates of the primary key.
Summarize Duplicates template - used to remove duplicate rows while retaining aggregate values for columns from the duplicate rows.
Click Save.
Union step
A union step combines two pipelines based on a set of rules per column. It combines the rows from the previous step in the current pipeline (the input pipeline) with the output rows from another pipeline (the union pipeline).
Note
Choosing to perform the mapping from the union column or the input column will result. For viewing convenience, it may be preferable to perform the mapping from the input column, as that will retain the column's position in the list of columns.
Select Union step type.
Choose a column to union with from the Union with drop-down.
Manually map a column in one pipeline to a corresponding column in another pipeline using the drop-down lists in the Union and In table columns.
To map a column in the input pipeline to a column in the union pipeline, use the drop-down list of columns in the Union table column.
To map a column in the union pipeline to a column in the input pipeline, click on the drop-down.
Click Save.
Unpivot step
Unpivot steps can be used to rotate input columns into row values. This transforms information resembling a spreadsheet pivot table into a relational form suitable for combining with other pipelines.
Although a single measure is automatically added when an unpivot step is created, additional measures may be necessary, depending on your data source and how you need to pivot your data.
Select Unpivot step type.
Return to the Initial step and expand the Preview area.
Examine Preview area data for the Initial step and verify the pipeline columns have been set to required measures and attributes.
Click Save.
Important
Only measures can be configured using an Unpivot step.
Note
If any measures share the same name in Pivot column key column, Data Hub assumes they share that key.
Add an additional unpivot measure and rename
Hover over the Initial step, and click the small arrow icon.
Click Unpivot to add an unpivot step after the initial step.
Rename the Pivotcolumn entry.
The column list (above Preview area) locates the column that was automatically labeled Pivot column.
Click the column to select it. The column is now highlighted.
In the Properties panel, type a new name for the column.
Click Save.
History step
The history step allows you to track changes in data model information over time. It allows you to snapshot your data at different intervals (points in time) and see what has changed.
Note
For accuracy and consistency, make the history step the last step in your pipeline.
On the pipeline that you want to track, click + to add a new step.
In the type dropdown, select History.
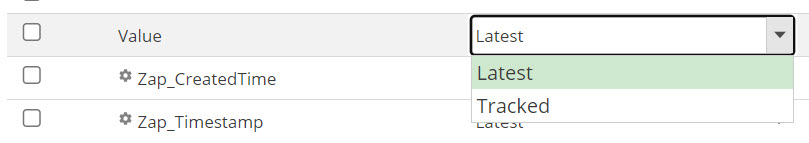
In the Type column of the step columns' grid, select the columns you want to track. By default, no columns are tracked (Latest selected by default).
Note
If a column is not set to tracked, it will just report the latest value.
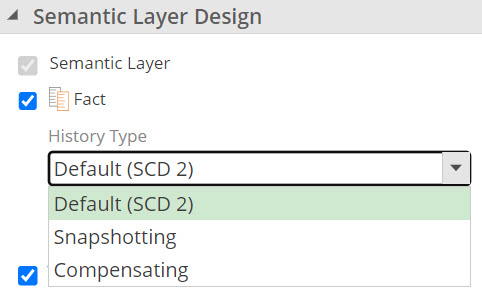
Specify the history type used for the pipeline (using the options in the Properties panel.
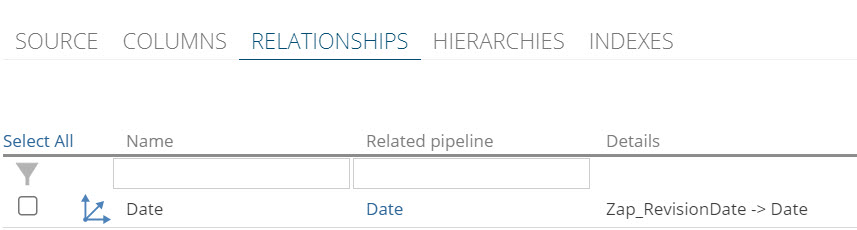
Review the RELATIONSHIPS pipeline tab. When a History step is added to a pipeline, reporting relationships are automatically added to the Date dimension.
Click Save and process.
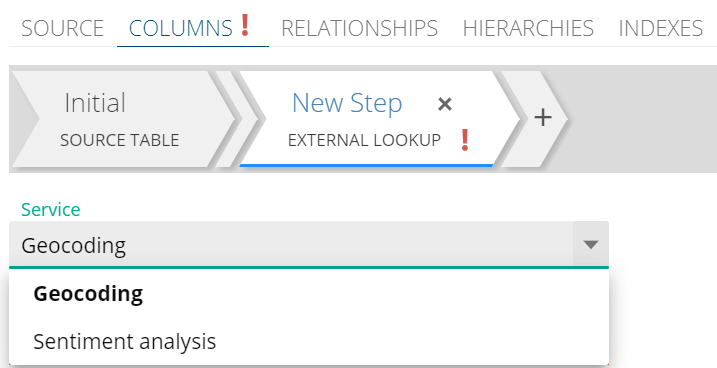
External Lookup step
The external lookup step provides the ability to lookup external data.
Geocoding
Geocoding provides coordinates for addresses, which enhances the ease of map chart creation significantly.
Prerequisites
In order to use the Geocoding step, you'll need:
An Azure maps account. Use an existing account or configure a new Azure maps account
Save the primary key to use when connecting in Data Hub.
Configure geocoding in Data Hub
Add an EXTERNAL LOOKUP step, and choose Geocoding from the Service dropdown.
Provide the following required field values:
Location column: Address column in your source data to be used as the input values for geocoding.
Azure maps subscription key: Key on your Azure maps account. (To find the key, follow the steps in the prerequisites section above.
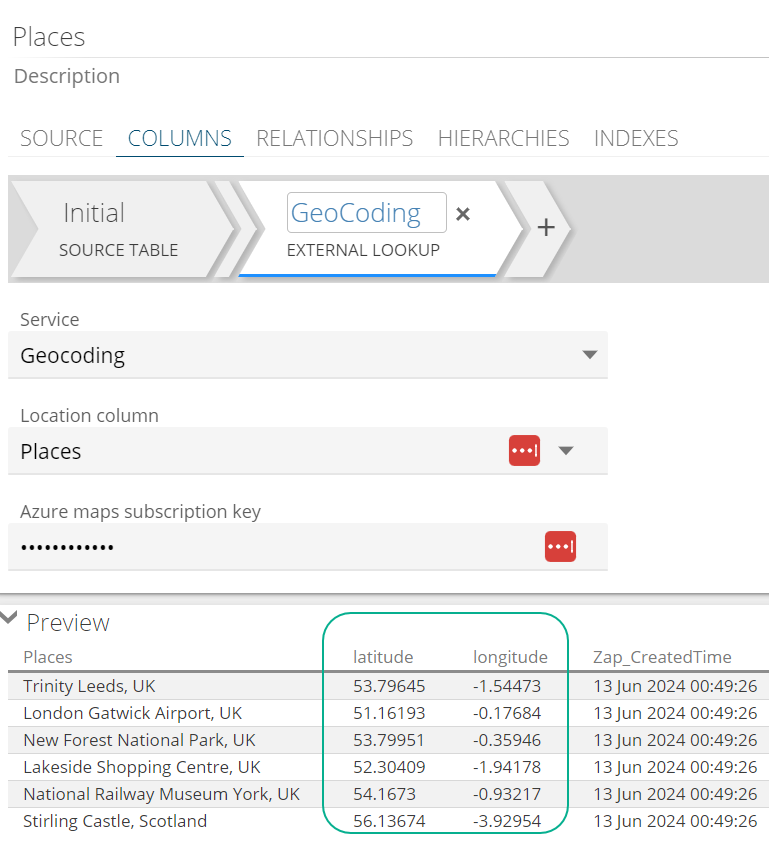
After processing, the latitude and longitude columns should be available to use in reporting.
Sentiment Analysis
Sentiment analysis, is a technique used to analyze text to identify and categorize opinions expressed as positive, negative, or neutral. Sentiment analysis can be used in any business sectors, e.g. marketing and social sciences to gain insights into public opinion and customer satisfaction.
Prerequisites
In order to use the Sentiment Analysis step, you'll need:
An Azure Language service. Use an existing service or configure a new Azure Language service.
Save the Primary key and Endpoint from step 1 to use when connecting in Data Hub.
Configure Sentiment Analysis in Data Hub
Add an EXTERNAL LOOKUP step, and choose Sentiment analysis from the Service dropdown.
Provide the following required field values:
Language service URL: The endpoint value available from the Azure language service
Azure language service key: The key on the Azure language service. (To find the key and endpoint, follow the steps in the prerequisites section above.
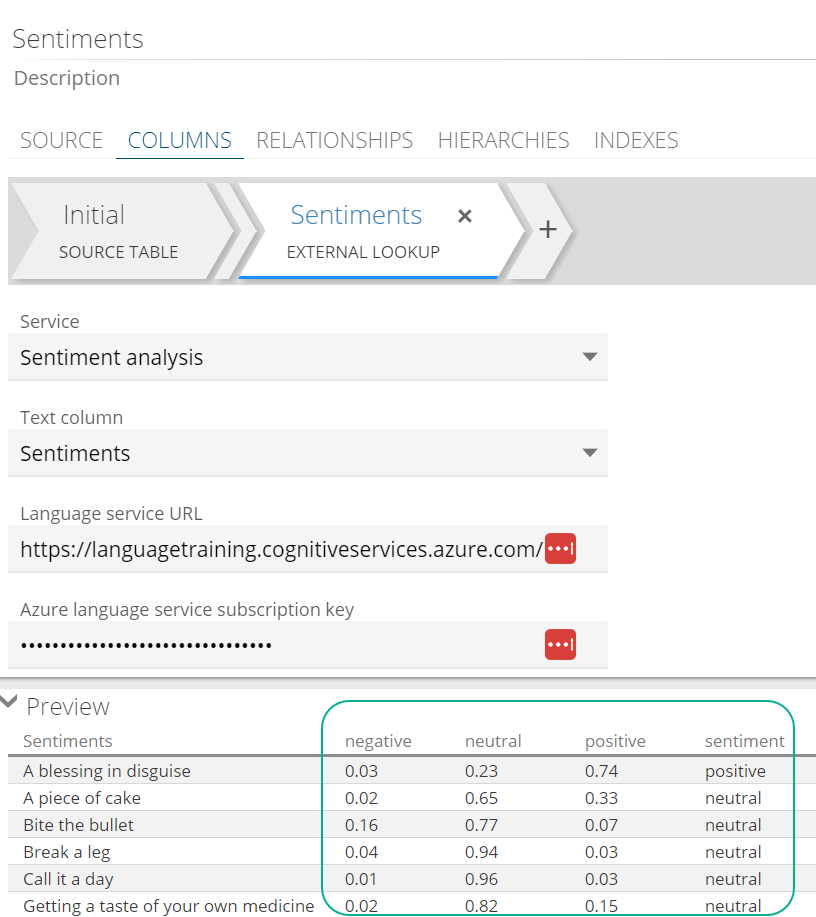
After processing, the negative, neutral and positive columns are available to use in reporting.
Classification Step
Shift your focus onto the rules grid by clicking any line
Click '+' to add a rule.

Add condition columns by clicking the paperclip icon in the rules grid, or '+' in the Classification Configuration panel on the right.
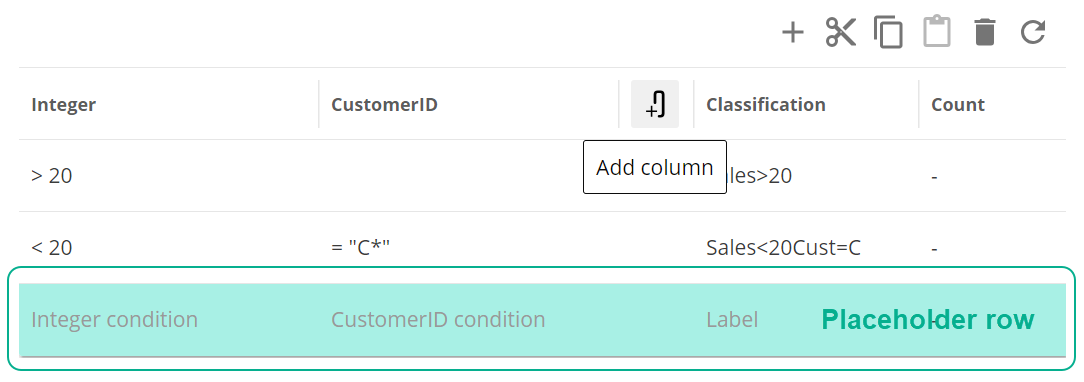
Delete condition columns by clicking the trash bin icon.
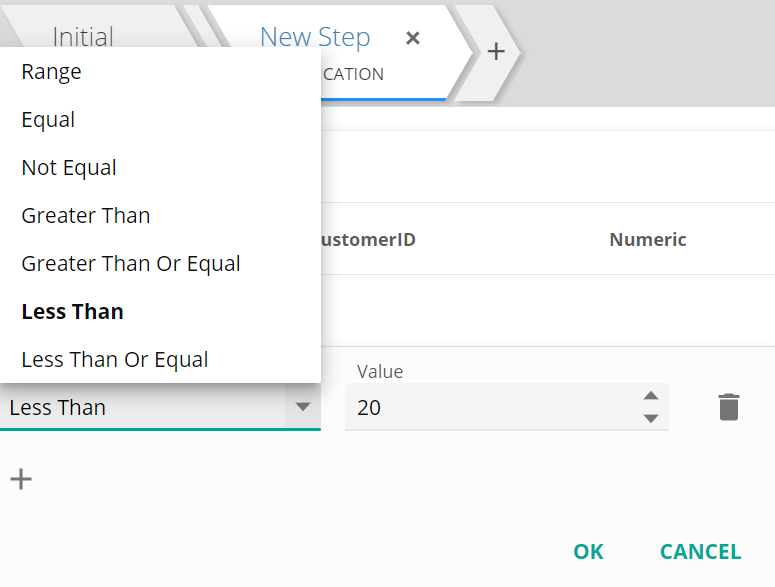
Specify the conditions of the rule.
Note
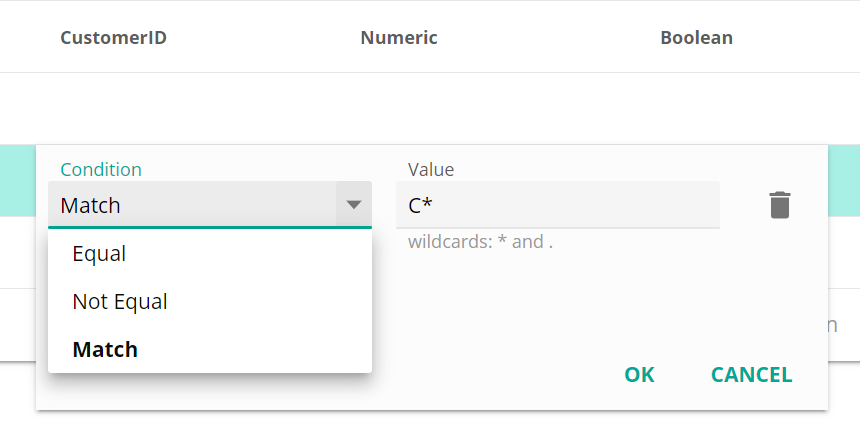
Conditions vary depending on the data type of the column.
When using text columns, you can use exact values to filter on, or partially matched values using wildcards. Below example will give all records that start with 'C'
The following grid functions can be used to configure rules.
Add, Cut, Copy, Paste, Delete, Refresh
Click refresh in the grid functions to apply the new rule to the counts. This helps identify if the rule is returning the results you need.
Click refresh in the preview to view the results in the data.
Filter a pipeline using a step
Filter pipeline source data
Expand the Filter list.
Click the + Condition button to add a row to the filter list.
Click the Column drop-down list, and choose a column for the filter.
Click the Operator to choose an operator.
If necessary, click the Not column to the left of the Operator text box to negate the condition.
Type a value into the Value combo box.
Click the stacked squares icon to the right of the Value text box to display a context menu that lets you change it to a column selector.
Filter pipeline staging data
Filter pipeline using staging data in a step
Select + to add a new step.
Select BasicStep
Scroll down to Filter
Select + Condition to add a filter
Select Column
Select Operator
Select Value.
Delete a step
Delete a step from a pipeline using the Delete step icon.
Note
You cannot delete the Initial step.
Click on the step to be deleted.
Click x to remove the step.