Getting started with tabular modeling
Welcome
Welcome to our comprehensive guide to getting started with tabular modeling within Data Hub. This documentation is designed to provide you with an in-depth understanding of tabular modeling in Data Hub, it's implementation, and strategic advantages. We'll explore the nuanced landscape of semantic layer technologies, focusing on the powerful capabilities of tabular modelling, its integration with leading platforms like Power BI and Azure Analysis Services, and guide you through the required steps to get started.
Note
Tabular modeling in Data Hub is an evolving technology. Our team is continuously enhancing features, with upcoming improvements in reporting capabilities and semantic layer integration.
Overview
Standard modelling in Data Hub is done using a multidimensional semantic layer instead of a tabular one. This remains the core approach in Data Hub, but tabular modeling is also now available for users to take advantage of.
The main reason you might want to choose a tabular approach over a multidimensional one is for Power BI support. Currently, all reporting for tabular (including analytics provided with pre-built solutions) is done via Power BI, whether the model has been deployed directly to a Power BI server, or an Azure Analysis Services one. That makes tabular an excellent choice if you want to leverage existing skills or license investments in the Power BI stack.
Note
Power BI analytics against a multidimensional cube are not available with Data Hub, the only options are to a tabular model, or directly to the warehouse, sacrificing any semantic modeling that has been done.
Additionally, tabular modeling with Data Hub offers exceptional benefits over simple Power BI implementations not utilizing Data Hub:
Data Quality and Integrity: Establish a trusted, centralized source of truth that systematically prevents data duplication and ensures consistent information management. By implementing rigorous semantic layers, you create a foundational framework for reliable analytics.
Enterprise Resource Planning (ERP) optimization: Leverage advanced data warehouse automation capabilities, including:
Seamless company consolidation processes
Intelligent currency translation mechanisms
Comprehensive time zone conversion strategies
Accelerated model development: Utilize pre-built data models to dramatically reduce implementation risks and development timelines. The semantic source of truth enables automatic synchronization of warehouse components, including tables, columns, relationships, and scheduling.
Power BI or Azure Analysis Services
To begin tabular modeling you will need to setup a server to host your model. There are two options for this; Azure Analysis Services and Power BI online. You will need to choose one of these to serve as a model server.
Power BI
Power BI online can be used as the server for tabular models. You'll require a minimum of one Premium Per User license (for the server itself) and Power BI pro licenses for every viewer user in your organization. If your organization is already using Power BI online to share reports, it's likely you already have these pro licenses.
This is likely the best option for smaller organizations with only a few users requiring access to the tabular model and reports in Power BI, or for those already paying for these Power BI pro licenses.
Note
Microsoft 365 E5 subscriptions include Power BI Pro
More information on Power BI licensing available here
Azure Analysis Services
Azure Analysis Services servers can be created in the Azure portal. You don't need individual user licensing for Azure Analysis Services and instead pay per server, based on its specifications. The base cost will be higher than Power BI, but Azure Analysis Services allows for more control over the server itself and offers support for larger datasets (>100gb).
More information about Azure Analysis Services costs can be found here
Setup a model server for Tabular
Power BI
Note
Data Hub does not support role management when deploying to Power BI, all role management will need to be done in Power BI on the deployed model.
Licensing requirements
To use Power BI as a model server for Tabular the user requires a Premium Per User subscription.
Required configuration
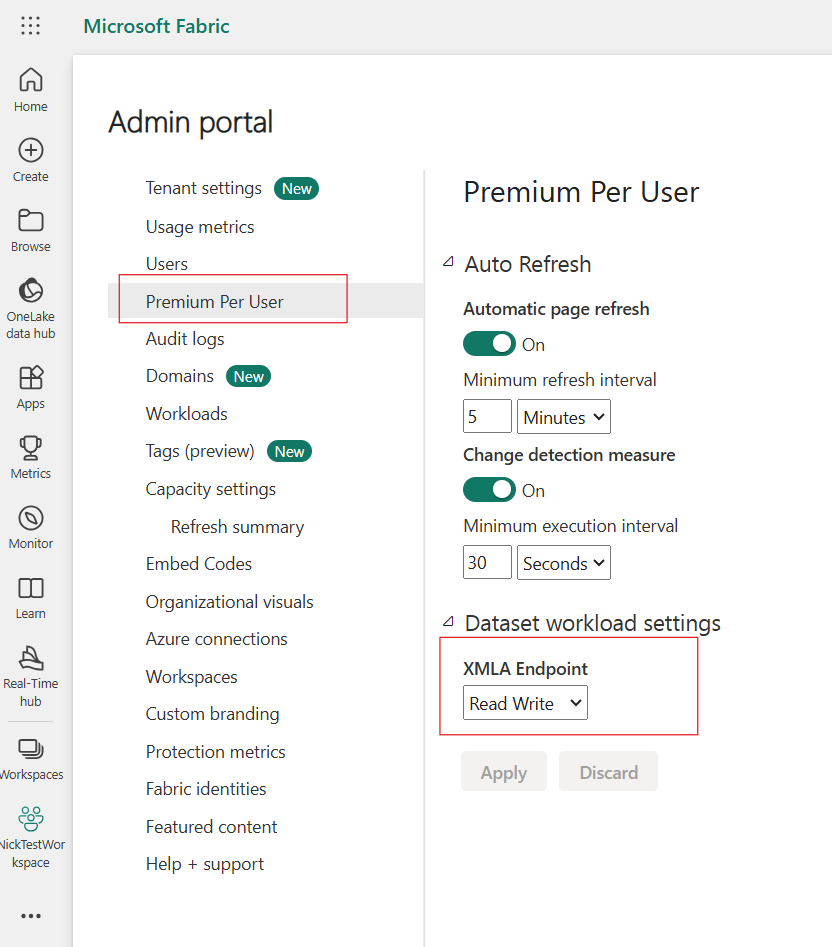
XMLA Read Write access needs to be enabled by the Power BI administrator.
Ensure the XMLA Endpoint has been set to Read Write (Located in the Admin portal -->> premium per user section).
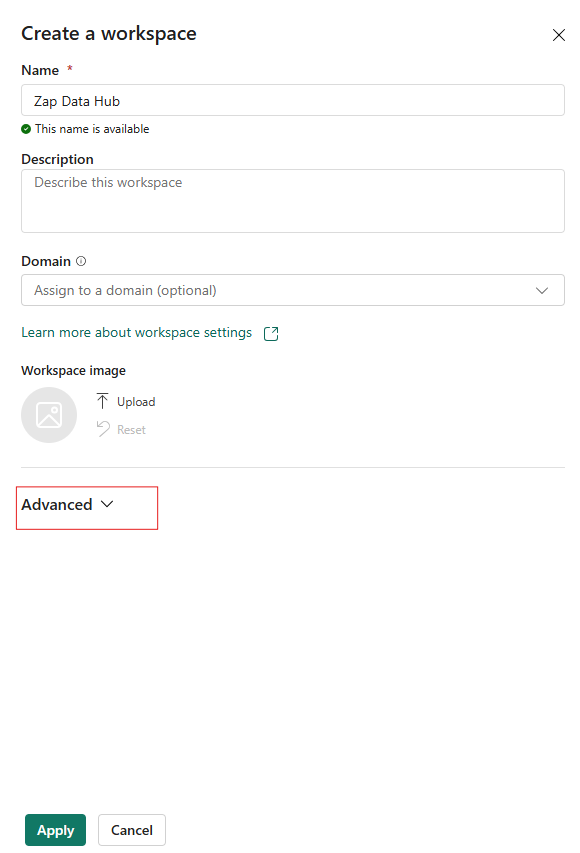
Setup a Power BI workspace, to be used as the server for Data Hub. A user with a premium per user subscription is required for this step.
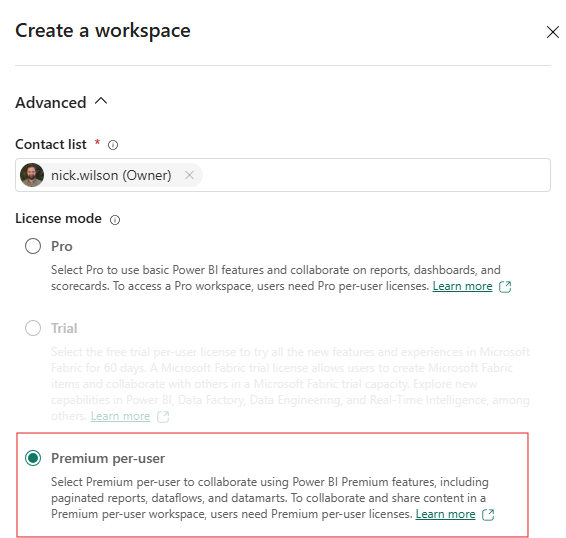
When creating this workspace ensure the user with premium per user is the owner and the license option (in the advanced section) is set to Premium per user.
If MFA is enforced on a user's Microsoft Entra logins, an application will also need to be setup in their Microsoft Entra, via the Azure Portal to allow Data Hub to authenticate properly.
Open the associated Microsoft Entra ID
Select Manage -->> App Registrations from the left navigation pane.
Press New Registration
The redirect URI needs to be https://services.zapbi.com/OAuthLoginRedirect . Supported account types needs to be accounts in any organizational directory. The app name can be anything.
Record the application/client ID for Zap Support.
Back in Azure, open Manage -->> Certificates and Secrets.
Create a new client secret.
Record the secret value for Zap Support.
Provide Zap Support with the Application ID and Application Secret to complete the setup.
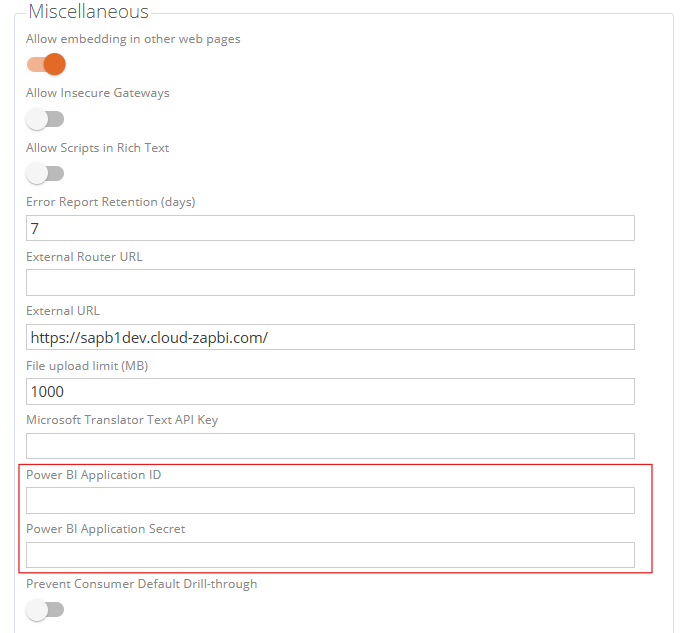
Data Hub Support interaction required. The Power BI application ID and Application Secret obtained from the setup in point 3 will need to be added to the Data Hub instance settings. If you have a cloud based instance, please contact Data Hub support. If you have an on-premise instance, a system administrator needs to add it to the application settings.
Data Hub Model Server connection
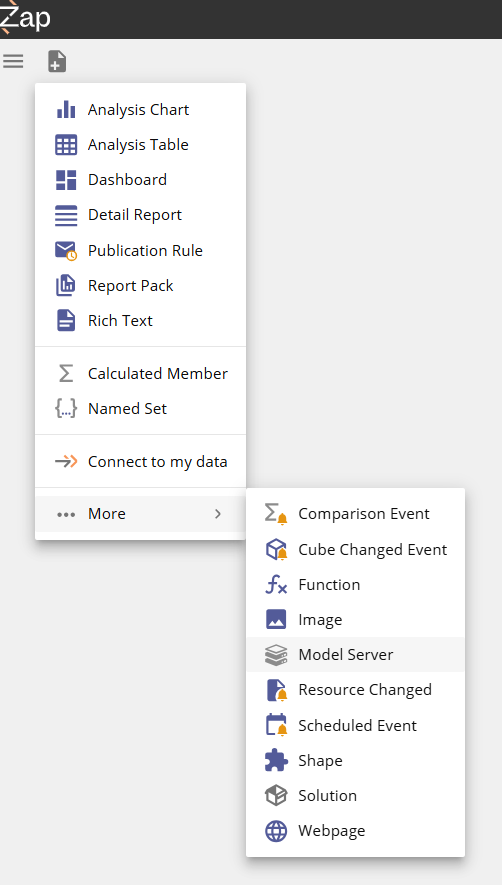
In Data Hub, from the New resource menu, choose Model Server.
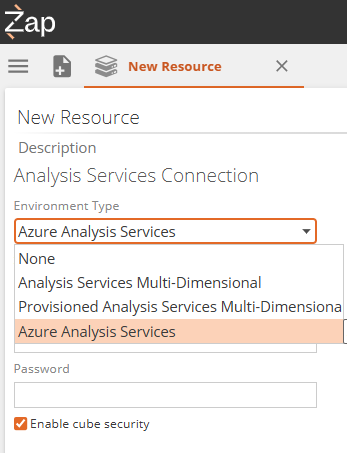
Select Azure Analysis Services from the Environment Type drop down in the Analysis Services Connection settings.
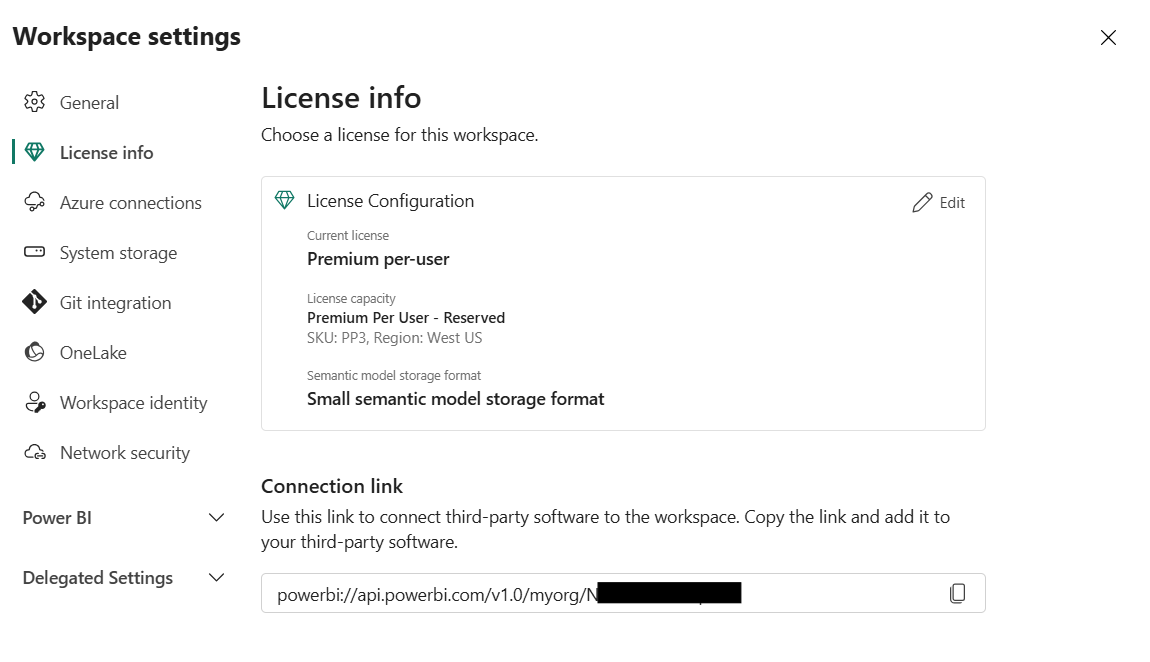
In the Server field, provide the connection link from the workplace settings -->> License info page.
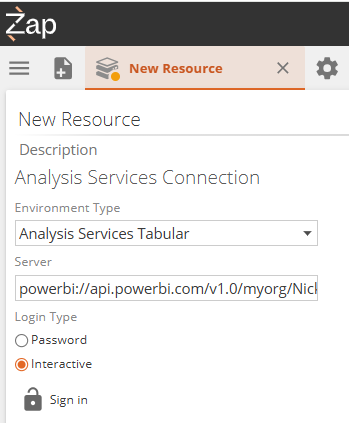
Login Type:
MFA required by the Microsoft Entra ID: If the setup for MFA described in step 3 of configuration was followed, select Interactive as the Login Type.
MFA not required: Select the Password for the Login Type and fill in the credentials for the user that owns the workspace (the one with a premium per user subscription).
Click Sign in and follow the sign in steps in the pop up. Ensure you sign in as the user with a Premium per user subscription.
Click Test Connection to ensure all details provided are correct and then save the Model Server.
Note
After testing the connection, you may receive a warning that the Deploying system extension to the cube "servername" failed. This can be safely ignored.

First time processing in Power BI
The first process of a model to Power BI will fail due to a "DMTS_DatasourceHasNoCredentialsError". This is due to a limitation in Power BI that requires that the Warehouse credentials to be used as the data source are entered manually.
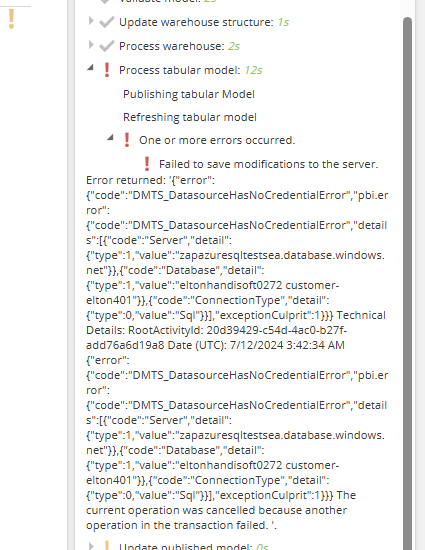
To solve this issue
Navigate to the associated Semantic model in the workspace in Power BI and select settings from the context menu.
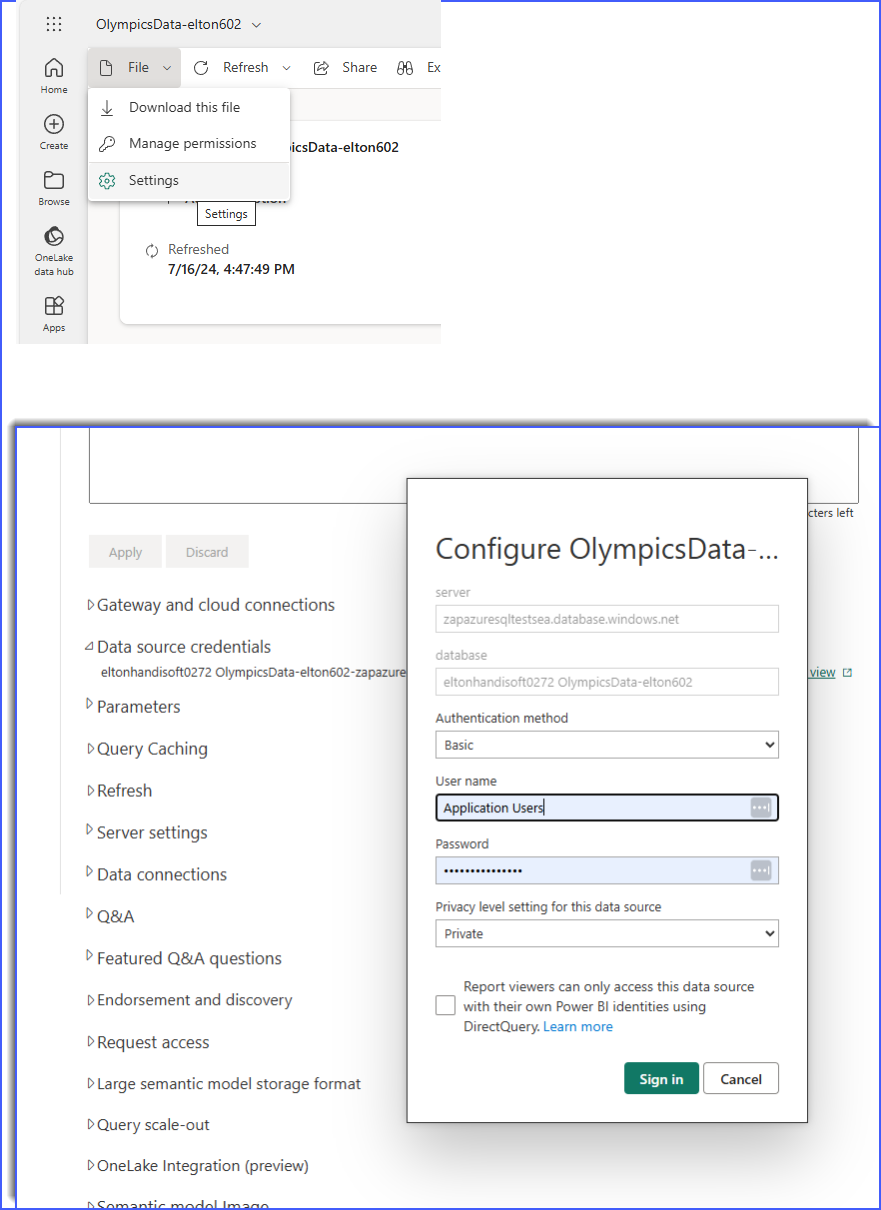
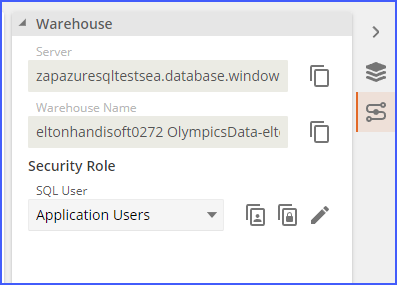
From here open the "Data source credentials" section and input the credentials for the warehouse. These credentials can be found in Data Hub by opening the model and selecting the connection details panel on the right (there are separate "Copy username" and "Copy password" buttons
Azure Analysis Services
Required configuration
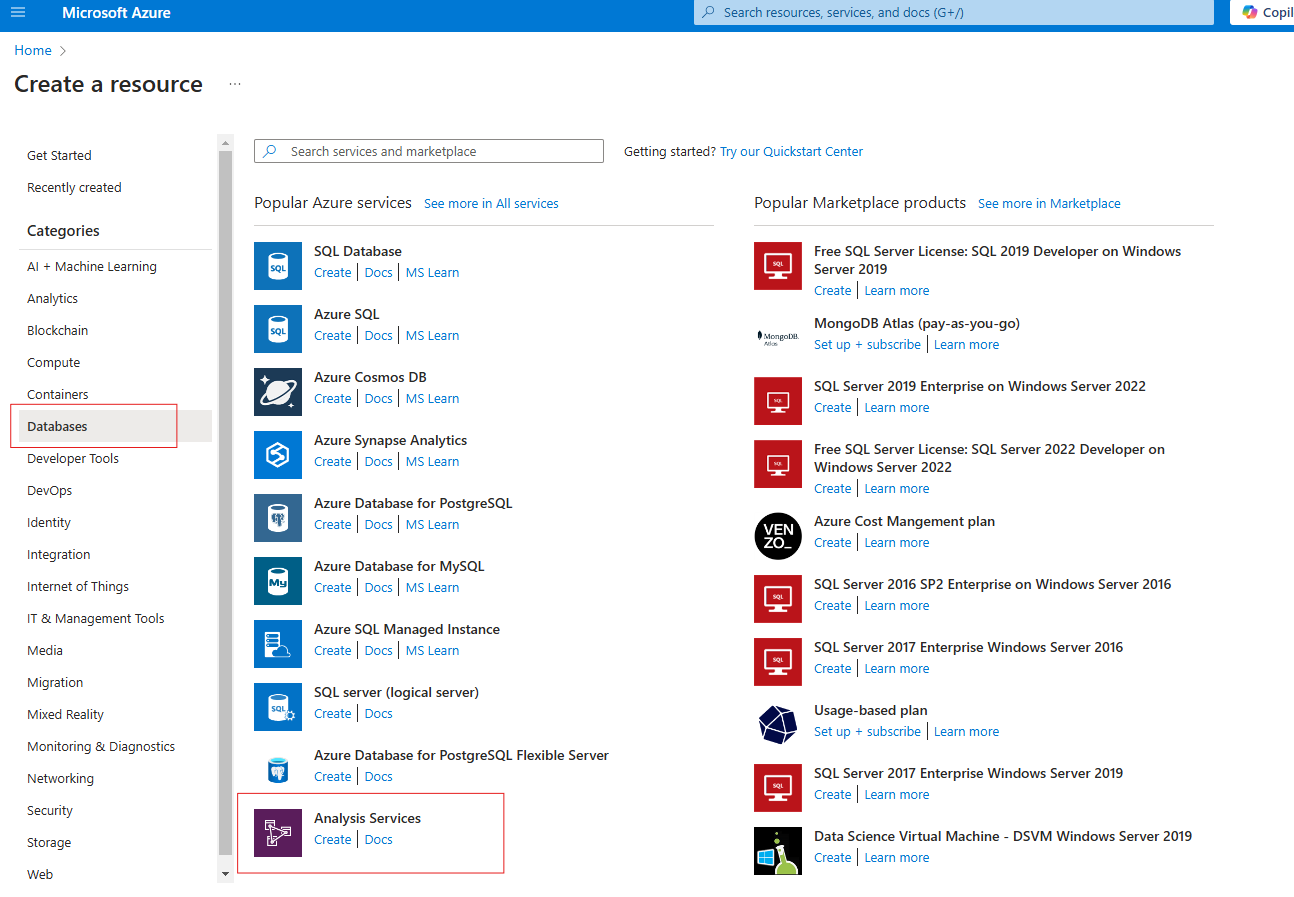
Create an Analysis Server in Azure - To use Azure Analysis Services as a model server an Analysis Server in Azure (found in the database section of resources) is necessary.
Data Hub authentication - needs to be configured for Microsoft Entra ID (formerly Azure Active Directory) to enable role management. Directions for this can be found at Entra ID.
Note
Support assistance is necessary to set this up for a cloud instance
Data Hub Model server connection
In Data Hub, from the new resource menu, choose Model Server.

Select Azure Analysis Services from the Environment Type drop down in the Analysis Services Connection settings.

In the Server field, provide the tabular server name found in the Azure portal on the server resource page.
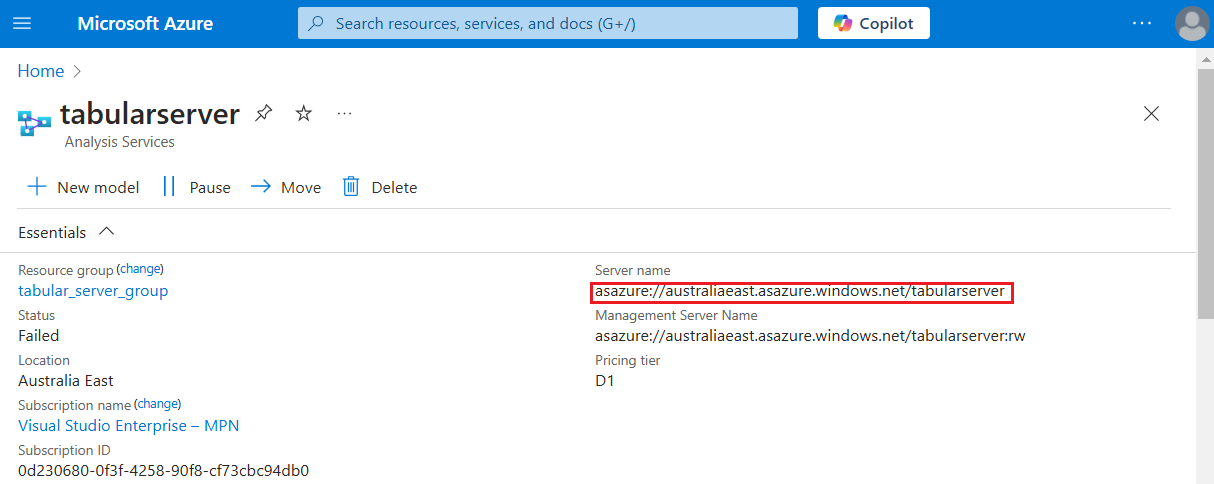
Login Type: Select password and fill in the user credentials for the server. This user should be an administrator of the Azure Analysis Services server.
Uncheck Override Authentication for Azure Analysis Services.

Setup a tabular model
Deploy a tabular model
Zap's pre-built model and analytics solutions are also available for Tabular. For deployment, please contact support.
Create (Convert) a tabular model
Important
The following steps are only relevant to creating a model. If you are deploying the tabular solution, these steps do not apply.
Creating a tabular model is achieved by first creating a dimensional model, and then converting it to a tabular model.
To do so follow these steps:
On your multidimensional data model, in the properties pane of the model, select the tabular model server you created above.
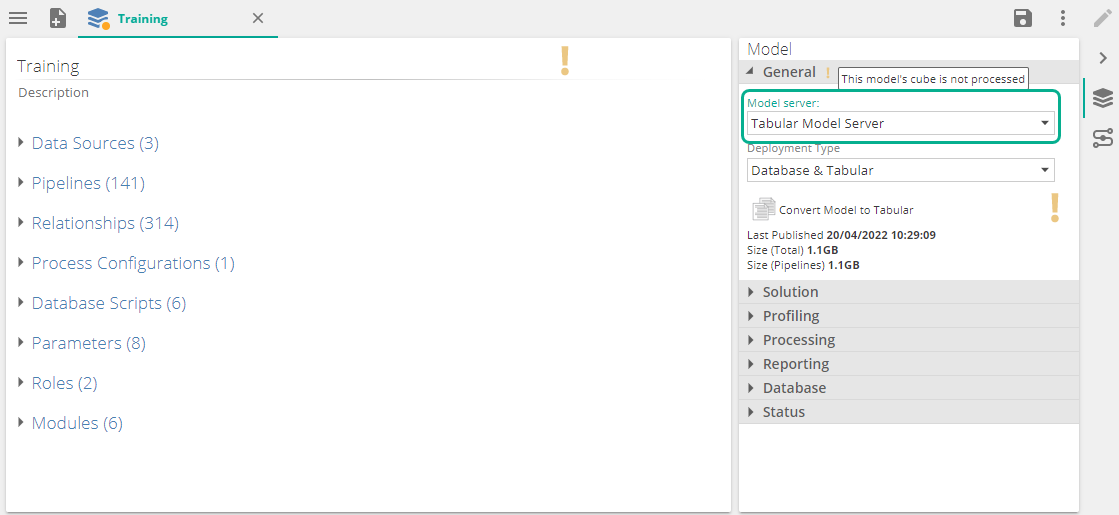
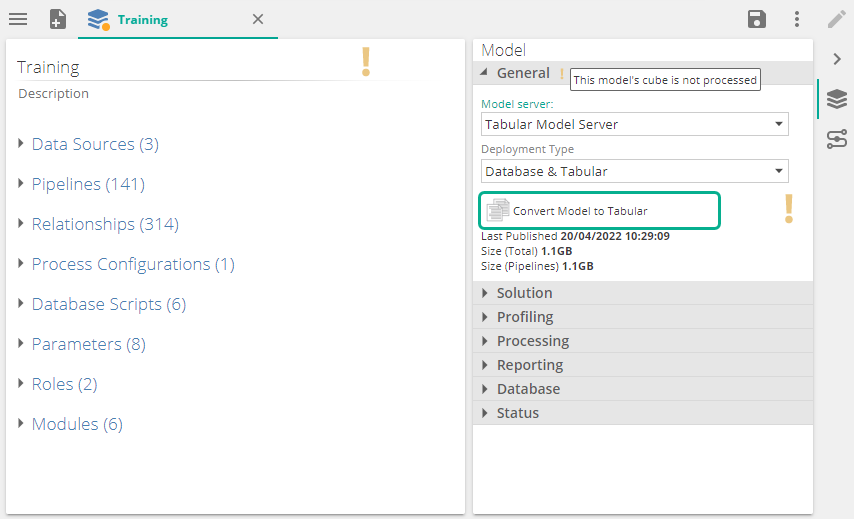
Save the settings and click on Convert Model to Tabular.
Differences after a model conversion
After conversion some or all of the following differences may be observed:
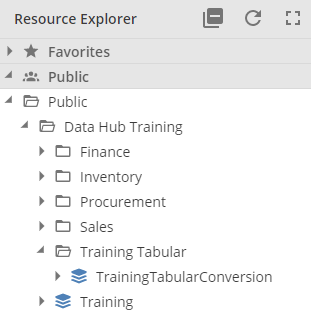
A Folder and model copy: A separate folder containing a copy of the original dimensional model, now converted to a tabular model. Note: The original model is untouched in its original location. Copy the new tabular folder and model elsewhere if required.
Relationship validation errors: Relationship errors might appear on some pipelines/relationships. Refer to Relationship design errors and new validation in Tabular to understand the design differences and validations that could occur with tabular relationships.
Attribute column captions and ordering: These are implemented differently in Tabular described in Attributes - column captions and ordering.
Row level security not available: Row level security implemented by the Limit Data section of the model role, is not available for Tabular, due to the structure of data stored in columns and not rows.
Incremental data load option: Add and Update not available: Tabular can only do a full load or a add only load during processing.
Relationship active/inactive status: On conversion this is used as a strategy to avoid validation errors based on the rules described in Active / Inactive relationship conversion on upgrade Read more about the concepts of Inactive relationships below.
Relationships to Date remapped: Due to the change in key columns for Date pipelines, Relationships To the date pipeline is updated.
Modeling differences in Tabular
Model design in Tabular differs significantly from multidimensional modeling. The main differences are around relationships and attribute column captions and ordering.
Relationships
Tabular analysis services has been designed to work with a "Star Schema" and design principles should be followed wherever possible. More info on Star Schema design can be found in Star Schema design for a semantic layer
The most important aspect for relationships in Tabular, is relating one Fact table to many Dimension tables, to support filtering and grouping, but Tabular requires that there be only one active relationship between two tables. Because Tabular automatically chains relationships that flow in the same direction, this means there can only be one path between any two tables, whether a direct or series of relationships.
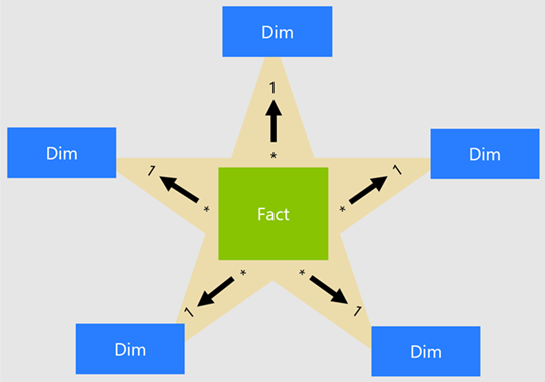
When it becomes necessary to include relationships that would otherwise produce ambiguous paths, two main strategies are discussed below:
Role playing relationships
Role-playing relationships are relationships in which the destination table is a copy of the original table, rather than the table itself. These are created in Data Hub by naming the relationship something other than the name of the destination table. When the tabular model is published the relationship will then point to a copy of the destination table named for the relationship. Role-playing relationships are useful in situations where two tables have multiple relationships between them and may need filters applied from both relationships at once. The main drawback of the use of these relationships is that the role-playing tables created increase memory usage relative to the size of the original. As such it's important to consider the destination table when making these decisions and try to avoid utilizing them for large pipelines (hundreds of thousands or millions of rows). Generally, these should be only used when the destination is a dimension pipeline and not when the destination is a fact pipeline.
Further information on the decision between active, inactive and role-playing relationships can be found in The Power BI guidance on inactive or active relationships provided by Microsoft.
Inactive relationships
Relationships can be set to be inactive within a tabular model. These relationships are then not used by default and don’t create ambiguous paths in the model. While an inactive relationship on its own has little value it can used in the calculation of a DAX measure via the USERELATIONSHIP function. This function effectively activates the relationship during the calculation of that specific measure. These measures can be created by entering their formulas in on the DAX tab of the pipeline. These inactive relationships and DAX measures are useful for individual measures on a pipeline that are to be filtered by a different relationship to the rest.
For example a sales pipeline may have multiple date relationships – order date and shipped date. Most measures on this pipeline may only care about the order date relationship for filtering purposes so this relationship would be set to be active. A separate measure used to display the number of orders shipped would need to be filtered by the inactive ship date relationship instead. By creating this measure as a DAX measure on the pipeline’s DAX tab and using the USERELATIONSHIP function to refer to that relationship this functionality can be achieved. More detail can be seen in The Power BI guidance on inactive or active relationships and documentation for the USERELATIONSHIP function can be found in USERELATIONSHIP Dax Function.
While inactive relationships that are not in use can be left in the model without contributing to ambiguous paths they provide no value and should be removed. They can later be added if they become necessary for DAX measures. Managing the relationships in this way helps reduce the complexity of a model and makes it easier to mange.
Attributes - column captions and ordering
Column captions and ordering refers to how the data will be displayed in reporting. For example, a month column may hold the value in the format yyyymm (202212), but when reported on, showing mmm yyyy (Dec 2022) may be much more pleasing and understandable. At the same time we want to retain the ability to order by the integer column, as this makes logical sense. Example 202201, 202202, 202203 etc as suppose to April 2022, Aug 2022, Deb 2022 etc
Dimensional modeling: Data Hub provides the ability to attach a Display value for each attribute by means of the Name Column property for attributes. The Order by column determines which column is used for the logical ordering.
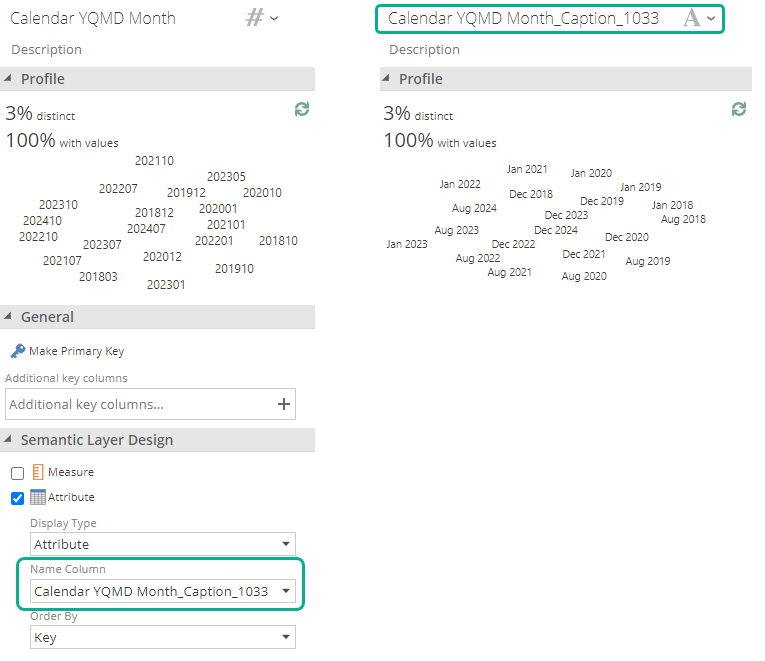
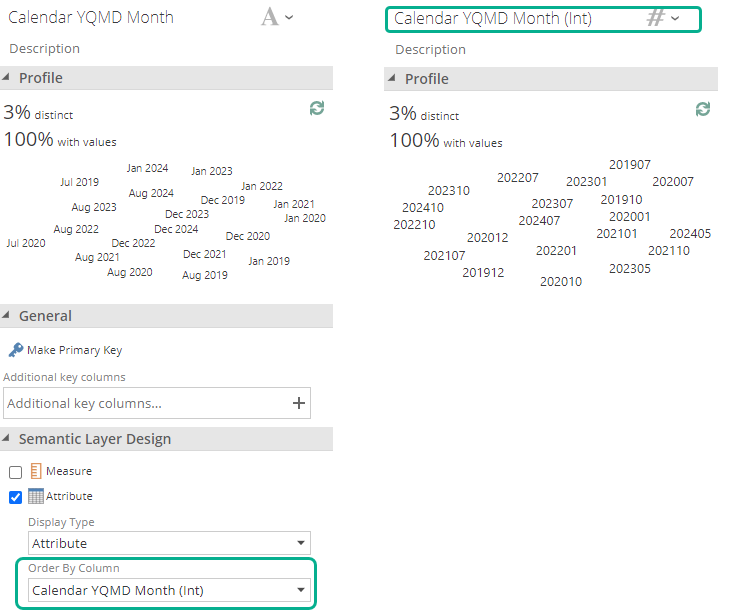
Tabular modeling: Has no concept of name columns. instead the columns containing the "display values" should be used. In order to specify the same logical ordering, the Order by column property is provided.
Date Pipeline
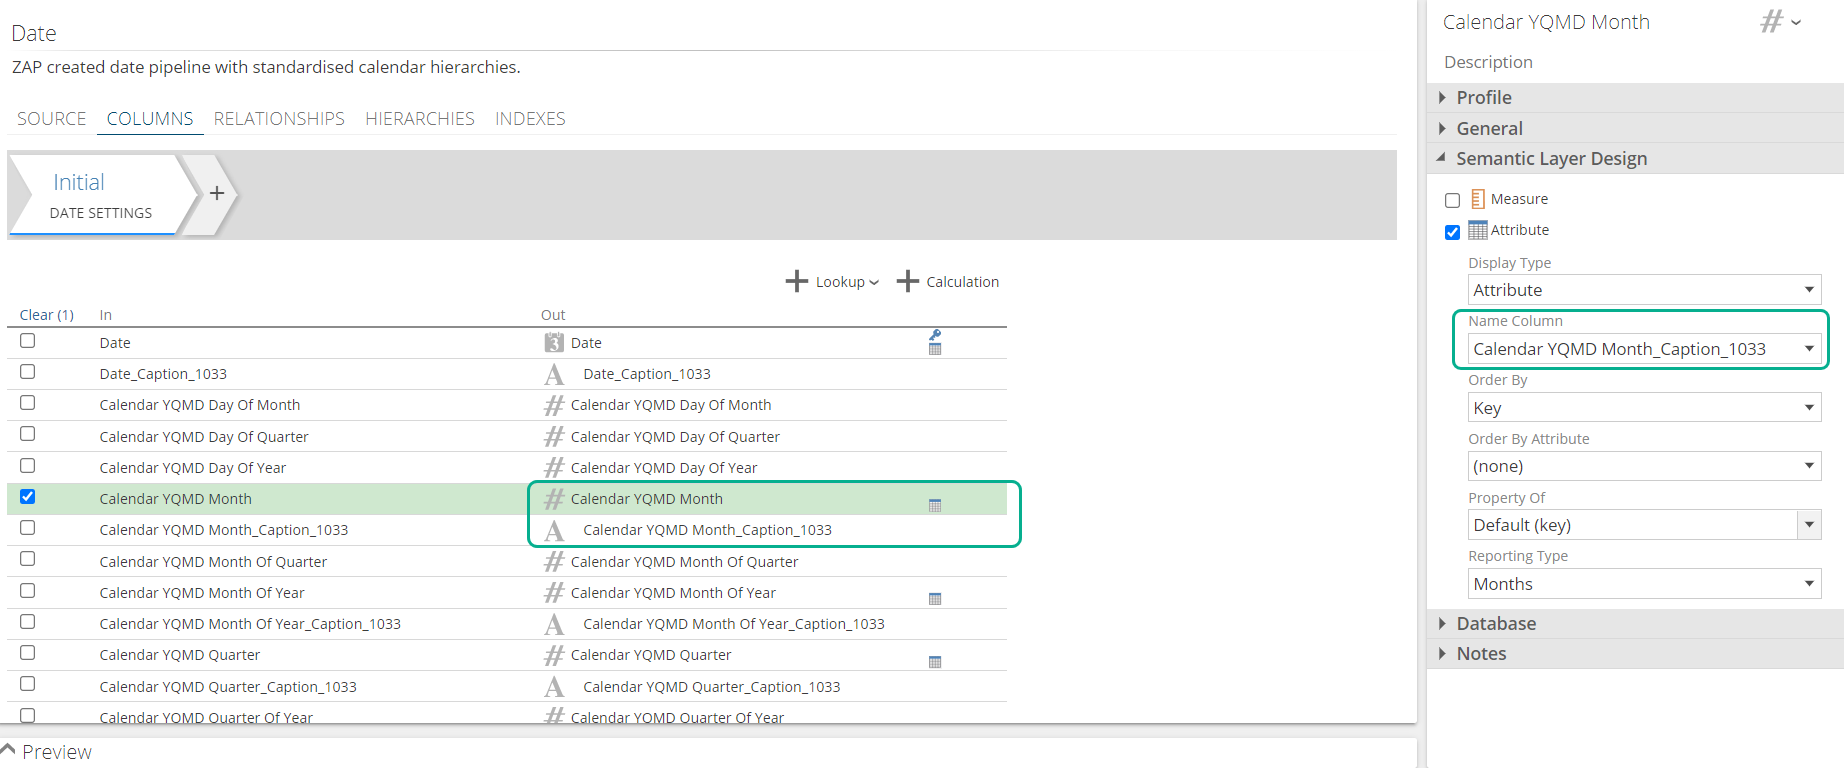
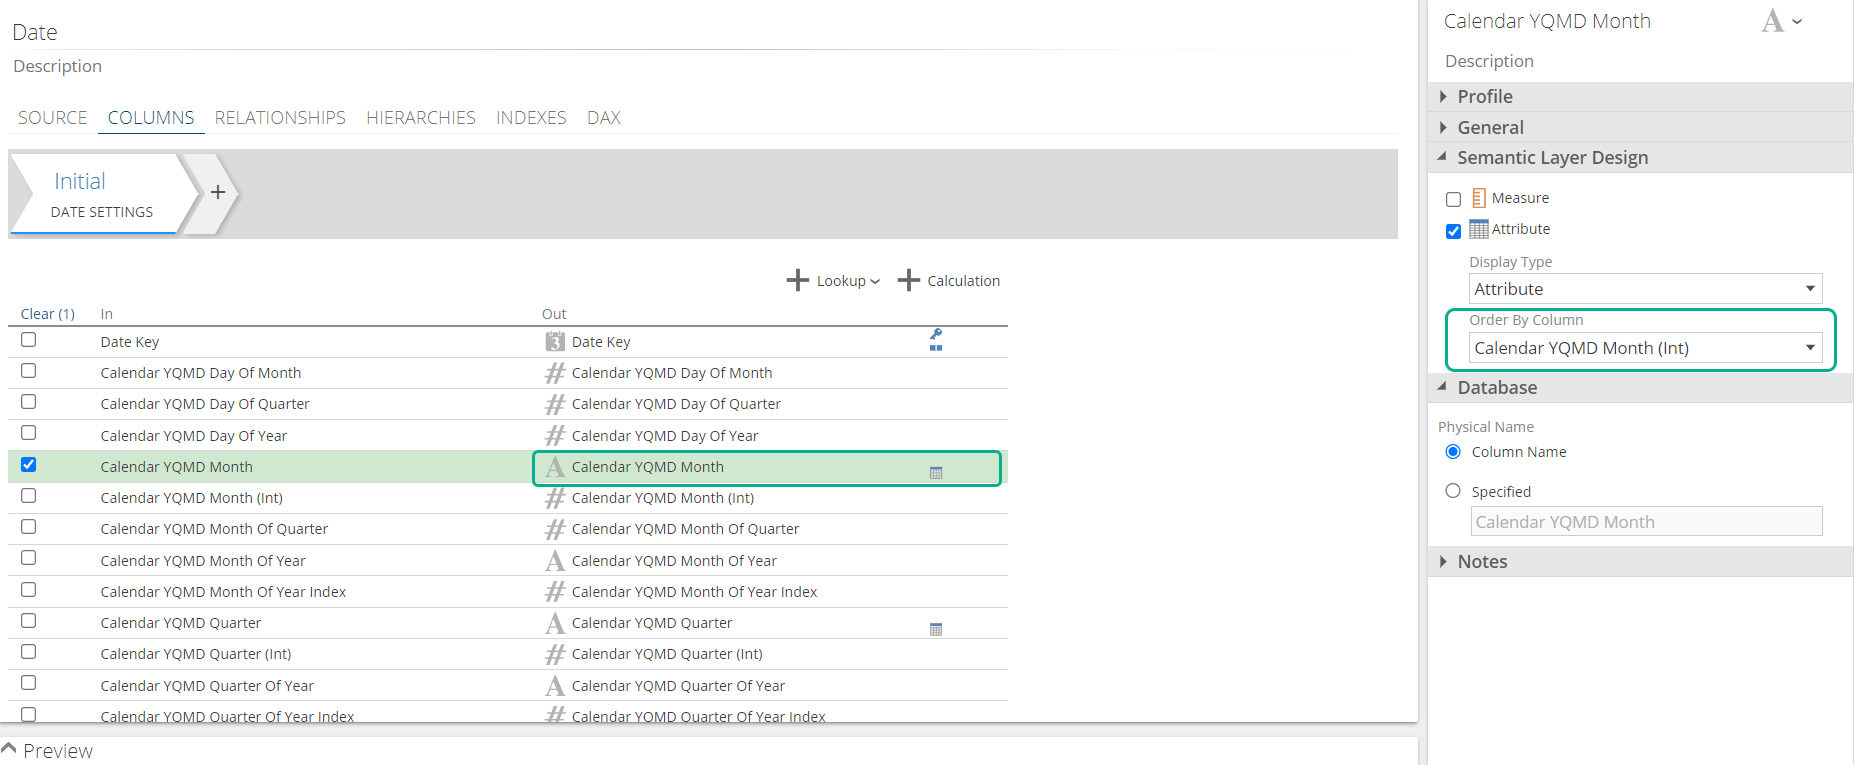
The Date pipeline is regenerated on conversion and has a significantly different structure, due to the name column changes described above. The Date pipeline under multidimensional is made up of value columns named Calendar YQMD Year, Calendar YQMD Month, Calendar YQMD Week, etc. and caption columns named Calendar YQMD Year_Caption_1033, Calendar YQMD Month_Caption_1033, Calendar YQMD Week_Caption_1033. Each value column has its associated Caption column mapped to the name column property.
 |
Because Tabular doesn't have name columns, the date pipeline is instead made up of caption columns named Calendar YQMD Year, Calendar YQMD Month, Calendar YQMD Week, etc. and value columns named Calendar YQMD Year (Int), Calendar YQMD Month (Int), Calendar YQMD Week (Int), etc. Each caption column has its Order By Column set mapped to the value column.
 |
Date Key change and relationships TO the Date pipeline updated
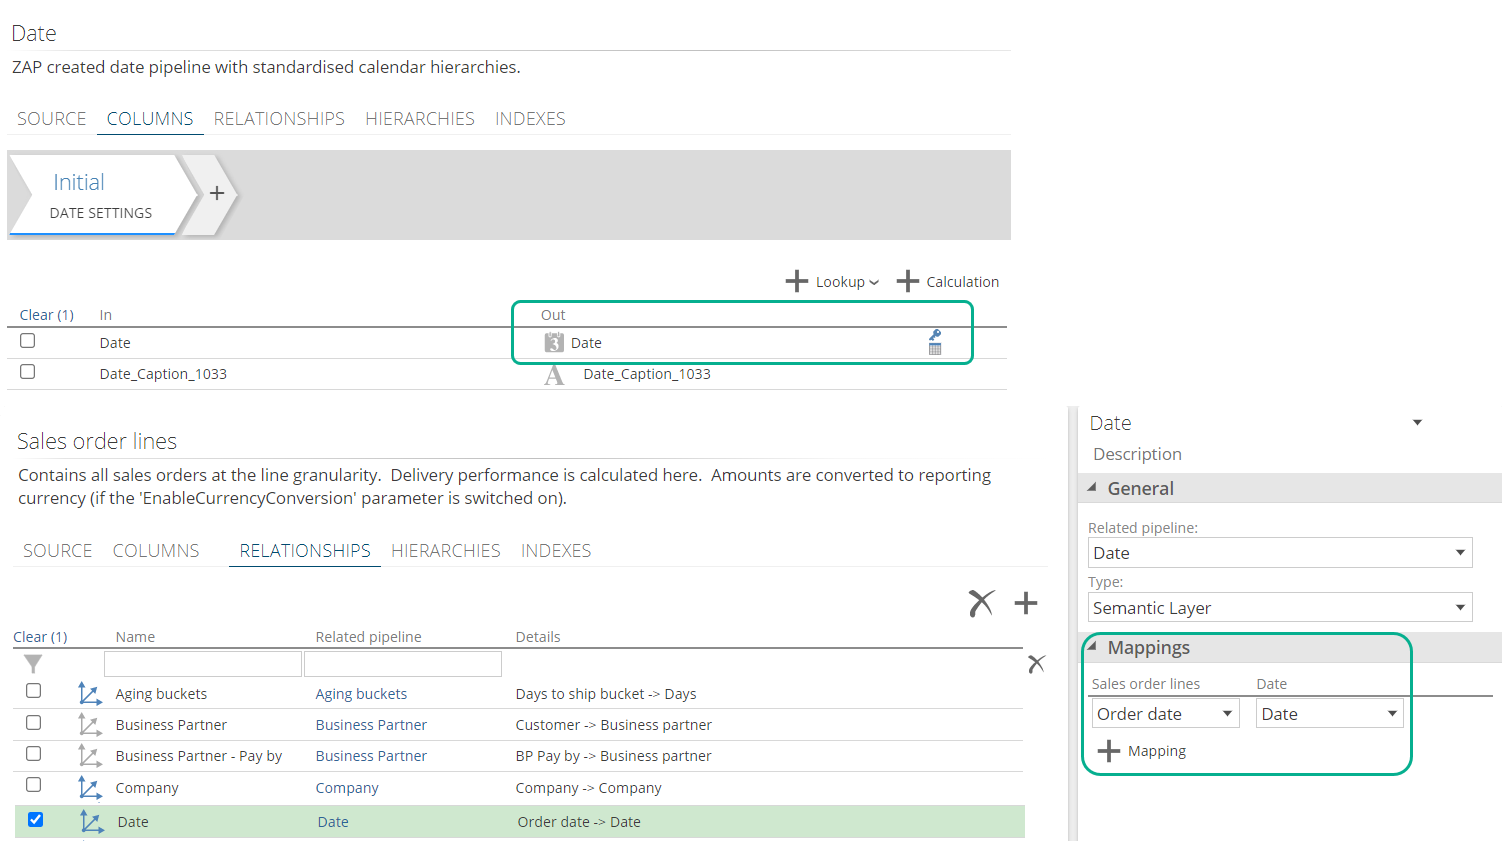
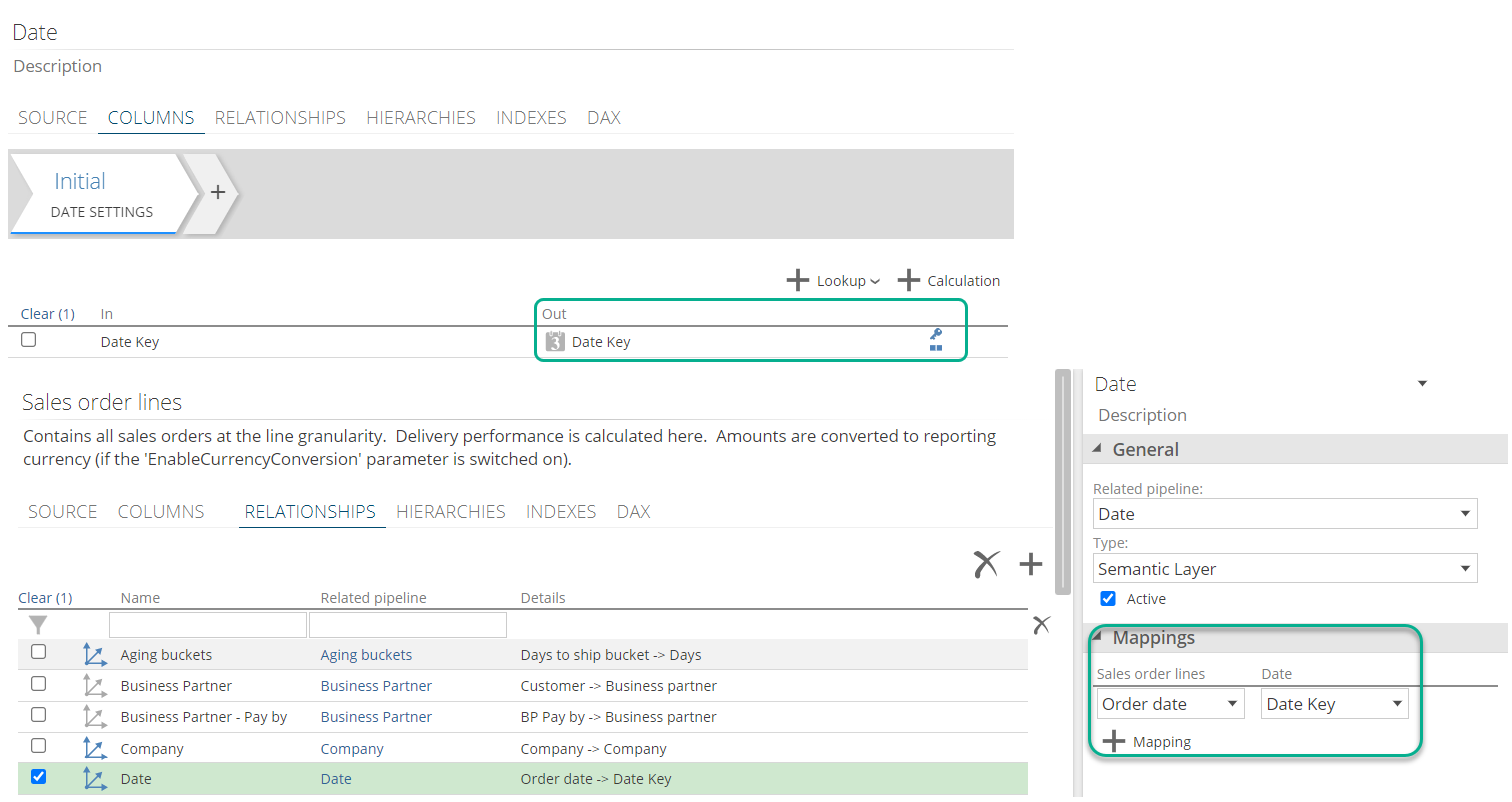
Additionally, the Date column in multidimensional becomes Date Key in Tabular (this is still the primary key column) and the associated Caption column is called Date. Due to this change in the Date Key column, relationships TO the date pipelines is also updated to map to the new Date Key column
Multidimensional Date Relationship to the "Date" Key column
 |
Tabular Date Relationship to the "DateKey" Key column
 |
Relationship design errors and new validation in Tabular
Relationship Cycles
Relationships forming a cycle is not allowed in Tabular. A relationship cycle is where pipeline A has a semantic relationship to pipeline B, and then a semantic relationship is created from pipeline B to pipeline A. This will result in a validation error.
Ambiguous Paths
Multiple paths (made up of active semantic relationships) cannot exist between two pipeline. If they do, a validation error will be shown on all the relationships involved in these ambiguous paths. Below is a simple example:
Pipeline A relates to B and C
Pipeline B relates to C
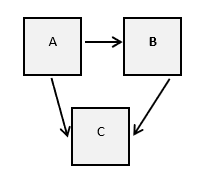
Ambiguous paths exist between A and C, thus all 3 relationships will show the validation error.
 |
 |
Note
Inactive semantic relationships and Roleplaying relationships are not considered for ambiguous paths. Roleplaying relationships where the relationship name does not match the related pipeline are considered as being related to a new pipeline.
Active / Inactive relationship conversion on upgrade
To avoid validation errors and work around restrictions on relationships in Tabular as mentioned above there needs to be some conversion applied to existing relationships in the model as part of the conversion. This takes the form of setting some relationships to inactive. Which relationships become inactive is determined by the nature of the pipelines at each end of the relationship. The below MATRIX shows the conversion:
Converted TO | ||||
Converted FROM | FACT | DIMENSION | FACT DIMENSION | DATE |
FACT | INACTIVE | ACTIVE | INACTIVE | ACTIVE |
DIMENSION | INACTIVE | INACTIVE | INACTIVE | ACTIVE |
FACT DIMENSION | INACTIVE | ACTIVE | INACTIVE | ACTIVE |