Bring data into your Model with Pipelines
A Pipeline is a configurable resource that defines a source, steps that transform or augment the data, and a destination. The destination can be a warehouse table or a SQL statement that combines multiple tables
Add a Pipeline
Add a Source Pipeline
Select an existing data source from your model.
The TABLES tab displays a list of tables.
Optional: If you do not see the table you are searching for, click Refresh Table List.
Note
Pipelines that are already included in the model show a pipeline logo.
Select Pipelines to add using check-boxes.
Remove any unnecessary calendars by right-clicking them and selecting Delete.
Add a Warehouse Pipeline
Open an existing model.
Expand the Pipelines section and right-click the Pipeline you want to use as the basis for the Warehouse Pipeline.
Click New Pipeline (this as source) to create the Warehouse Pipeline.
Your new Warehouse Pipeline will display under the Pipelines section with the name From (name of initial Pipeline).
Note
The source pipeline's relationships and columns are copied to the warehouse pipeline.
The pipeline default name is based on the origin pipeline.
Add a Source SQL Pipeline
Add via the Data Sources List
In the Data Sources list on the model screen, right-click the data source you want to create the pipeline.
Select New SQL Pipeline to reveal Source SQL Pipeline tab and SOURCE pipeline tab.
Enter a valid SQL expression in Source SQL text-box to create the pipeline.
Click Apply.
Add via a Data Source Tab
Click the data source in the Data sources list.
Click + Source SQL Pipeline.
Enter a valid SQL expression in Source SQL text box to create the pipeline.
Click Apply.
Add a Warehouse SQL Pipeline
Expand the Pipelines section on the Model screen and click + Warehouse SQL Pipeline.
Enter a valid SQL expression in Warehouse SQL text box to create the pipeline.
As you type, suggestions are displayed and can be selected.
Alternatively, enclose the pipeline name with $ characters (e.g.,$Customer$).
Drag pipeline entries from ResourceExplorer to create the SQL expression. The SQL syntax is validated as you type it.
Click Apply to evaluate the expression.
Add a Data Entry Pipeline
Expand the Pipelines section on the Model screen and click + Data entry.
On the new data entry screen, add columns and rows in the data grid in one of the following ways:
Manual typing.
Copying (Ctrl-C) and pasting (Ctrl-V) within the grid
Pasting data from Excel (this grid will auto expand to adjust to the data set)
Duplicating a cell from the grid by dragging the cell downwards (like in Excel)
Rename column names and change data types in the Data Entry Grid Settings tab.
Delete rows and columns
Deleting rows and columns can be done in the following ways:
Individual cells: Select one or more individual cells and press the Delete key
Row(s): Select one or more rows in the checkbox on the left and press the Delete key
Column(s): Use the bin icon in the column settings panel to delete columns one at a time.
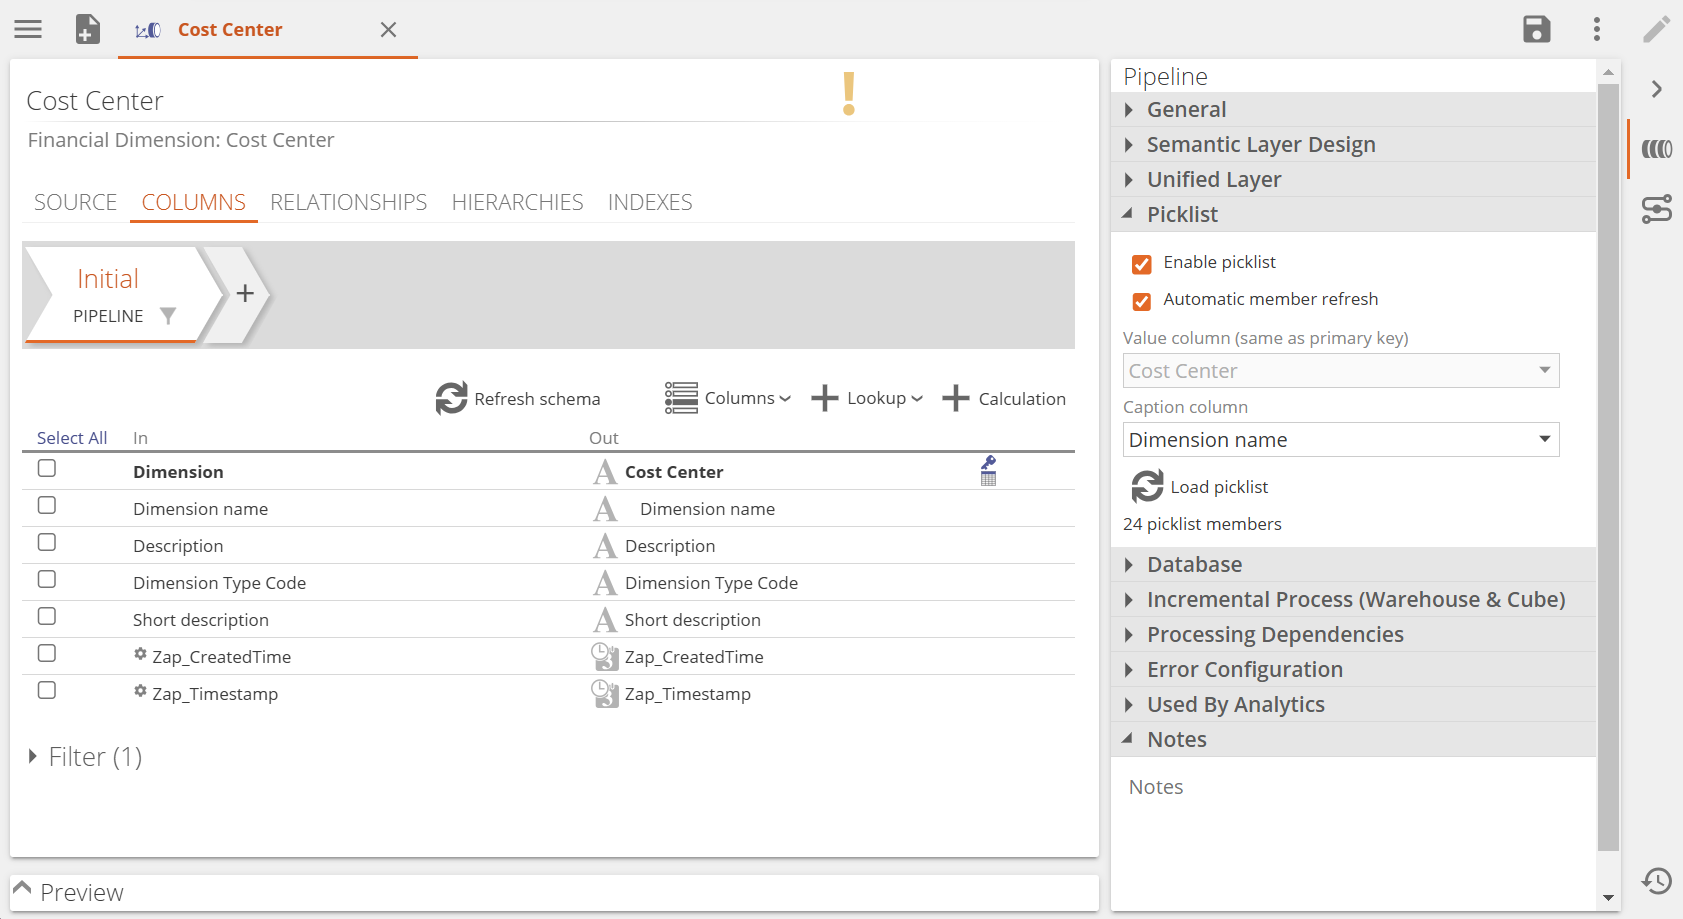
Use a picklist in a data entry pipeline
Open any pipeline with relevant data and enable the picklist function.
In the pipeline panel, picklist section, enable picklist
Specify the value and caption columns.
Load the picklist values
Note
Picklists can have a maximum of 100 values.
In the data entry pipeline, in the columns settings panel, add a column.
Change the data type to picklist, and select the relevant picklist.
Use the picklist column in the data grid to assign picklist values to rows.

Delete a pipeline
Important
This operation cannot be undone.
Select the pipelines you would like to delete from the Pipelines list.
Click Delete Pipeline.
Click one of the following:
Delete Selected: to remove the select pipeline shown in the Selected list.
Delete and Fix: remove the entire dependent warehouse, warehouse SQL pipelines, and parts of other pipelines that use the selected pipeline/s (such as relationships, lookups, and union steps). The parts that will be deleted are listed in the Used By list above this button.
Cancel: to cancel the action.
Configure a Date Pipeline
All data models include a date dimension added to the cube. The Configure Calendars screen allows you to specify various date dimension settings, including date calendars. Each calendar is used to generate a date hierarchy in the cube. Once added to the cube, the hierarchies can be accessed from the automatically generated Date pipeline.
In the area above the calendar list, adjust the following information:
First day (start date) for the date dimension.
Last day (end-date) for the date dimension.
Use the Enable Dynamic Last Day setting to make the latest possible date in the date dimension relative to the current year, plus some offset in years (which you can customize using the corresponding text box). By default, this setting is enabled.
Date format. The format used by the date dimension. A preview of each format appears to the right of the format's name in the drop-down list.
Select a calendar from the list in the middle of the tab.
In the Design panel, adjust the additional settings for each calendar. These vary based on whether you have selected a regular or fiscal calendar.
Remove any unnecessary calendars by right-clicking them and selecting Delete.
Optional
Add additional calendars.
Click the + Calendar button.
Select Regular or Fiscal to add the calendar to the list.
Adjust the calendar's settings.
Restrict data volume with the date pipeline global filter
Filter date ranges for data models, limiting the dates used by selected pipelines. Only measure group pipelines get filtered (and only if they relate to the Date pipeline dimension using a For reporting relationship).
In the Date pipeline's Global Date Filter area, click the Enabled check box.
Define the corresponding date range using the First day and Last day text boxes.
Specify which pipelines in the model will use the filtered date range.
Click Finish.