Distribution and Validation
Distribution
Publication Rules
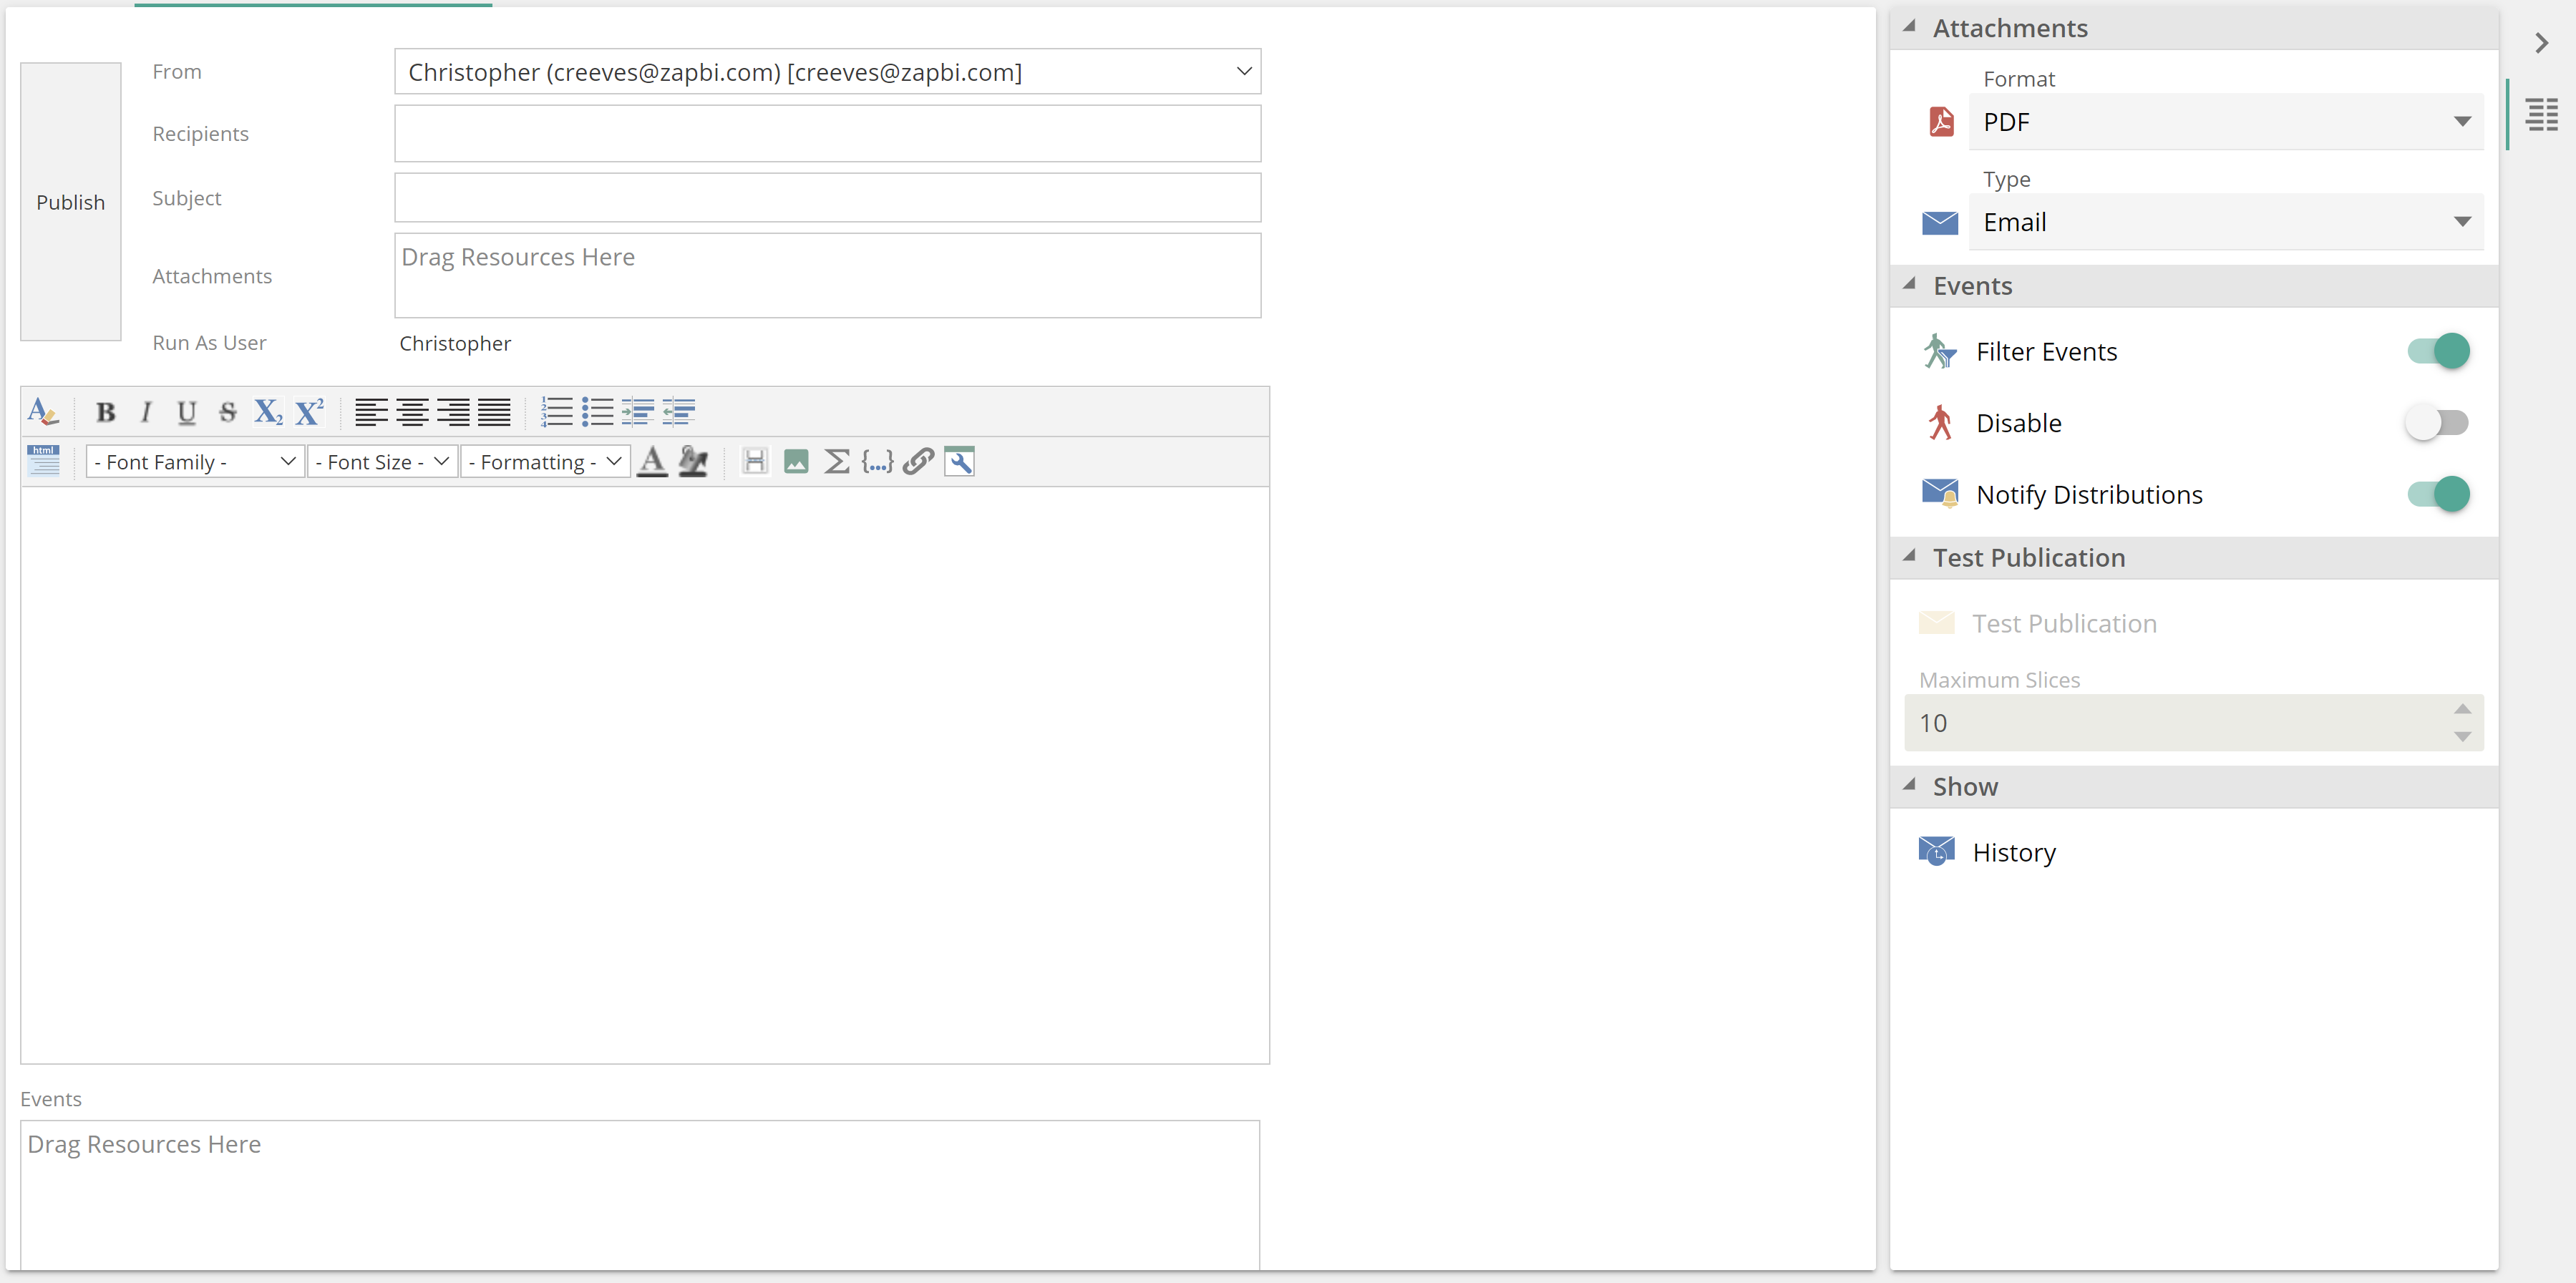
Once created, analytics may be automatically distributed to users using Publication Rules. A Publication Rule defines the recipients, contents, and events that may trigger a distribution, as in the following image.
 |
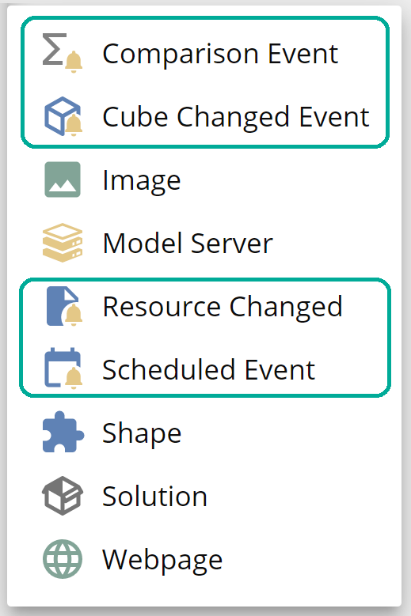
Events are themselves resources that are dragged to the Events pane. The following snippet from the New resource menu shows the available event resources.
 |
For information on creating a Publication Rule, see the Create a Publication Rule how-to article and the Publication Rules reference articles from the online documentation. One interesting capability for which you may refer to the online documentation is distributing a different slice of data to each recipient. This is referred to as recipient slicing.
Report Packs
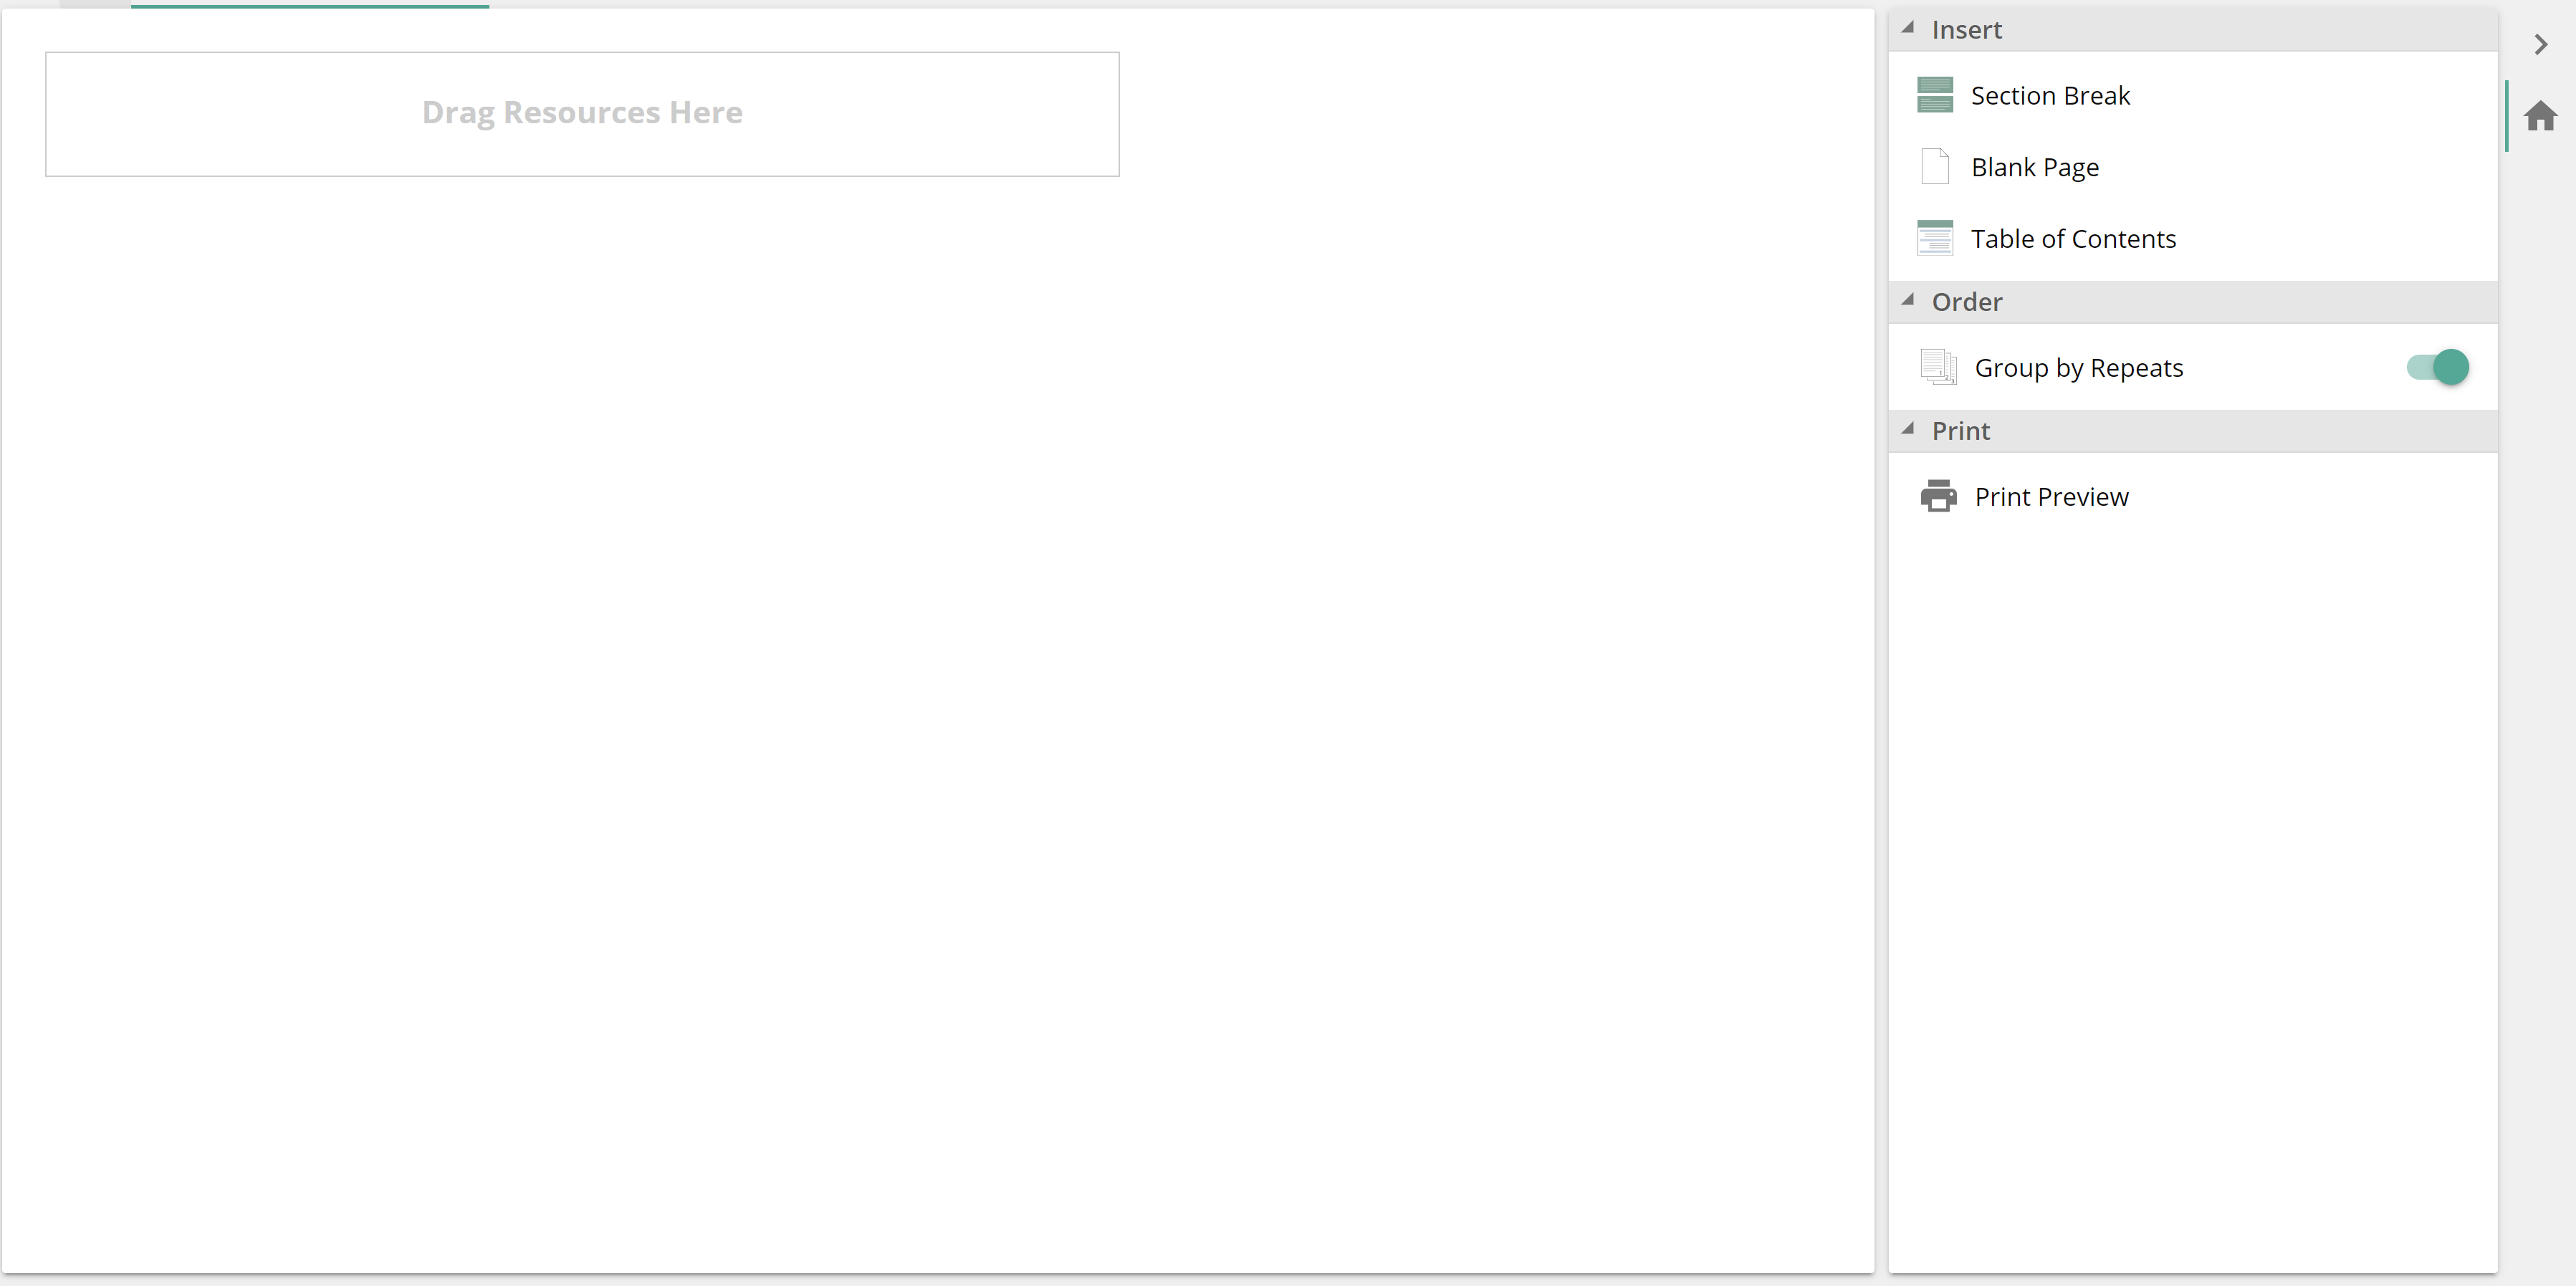
Report Packs allow you to generate a collection of resources as a single PDF for distribution purposes. Report Packs may also serve as an on-demand solution to some print requirements. As with dashboards, Report Pack design is a simple drag-and-drop experience, as in the following.
 |
For information on creating a Report Pack, see the Create a Report Pack how-to article and the Report Packs reference articles from the online documentation.
Analytic validation
Occasionally changes to a data model may break dependent analytics. Such changes may include name changes to dimensions, hierarchies, levels, measure groups, or measures. Alternatively, any of these objects may be removed by the model designer. It is also possible that a model’s data refresh removes members on which an analytic depends. For all of these scenarios, it is possible to remap the missing objects using the Missing Members option from the Resource Explorer context menu. This is an extremely powerful tool if you have a suite of analytics that requires updating. The Missing Members option is available for an individual resource and for a whole folder, as in the following.
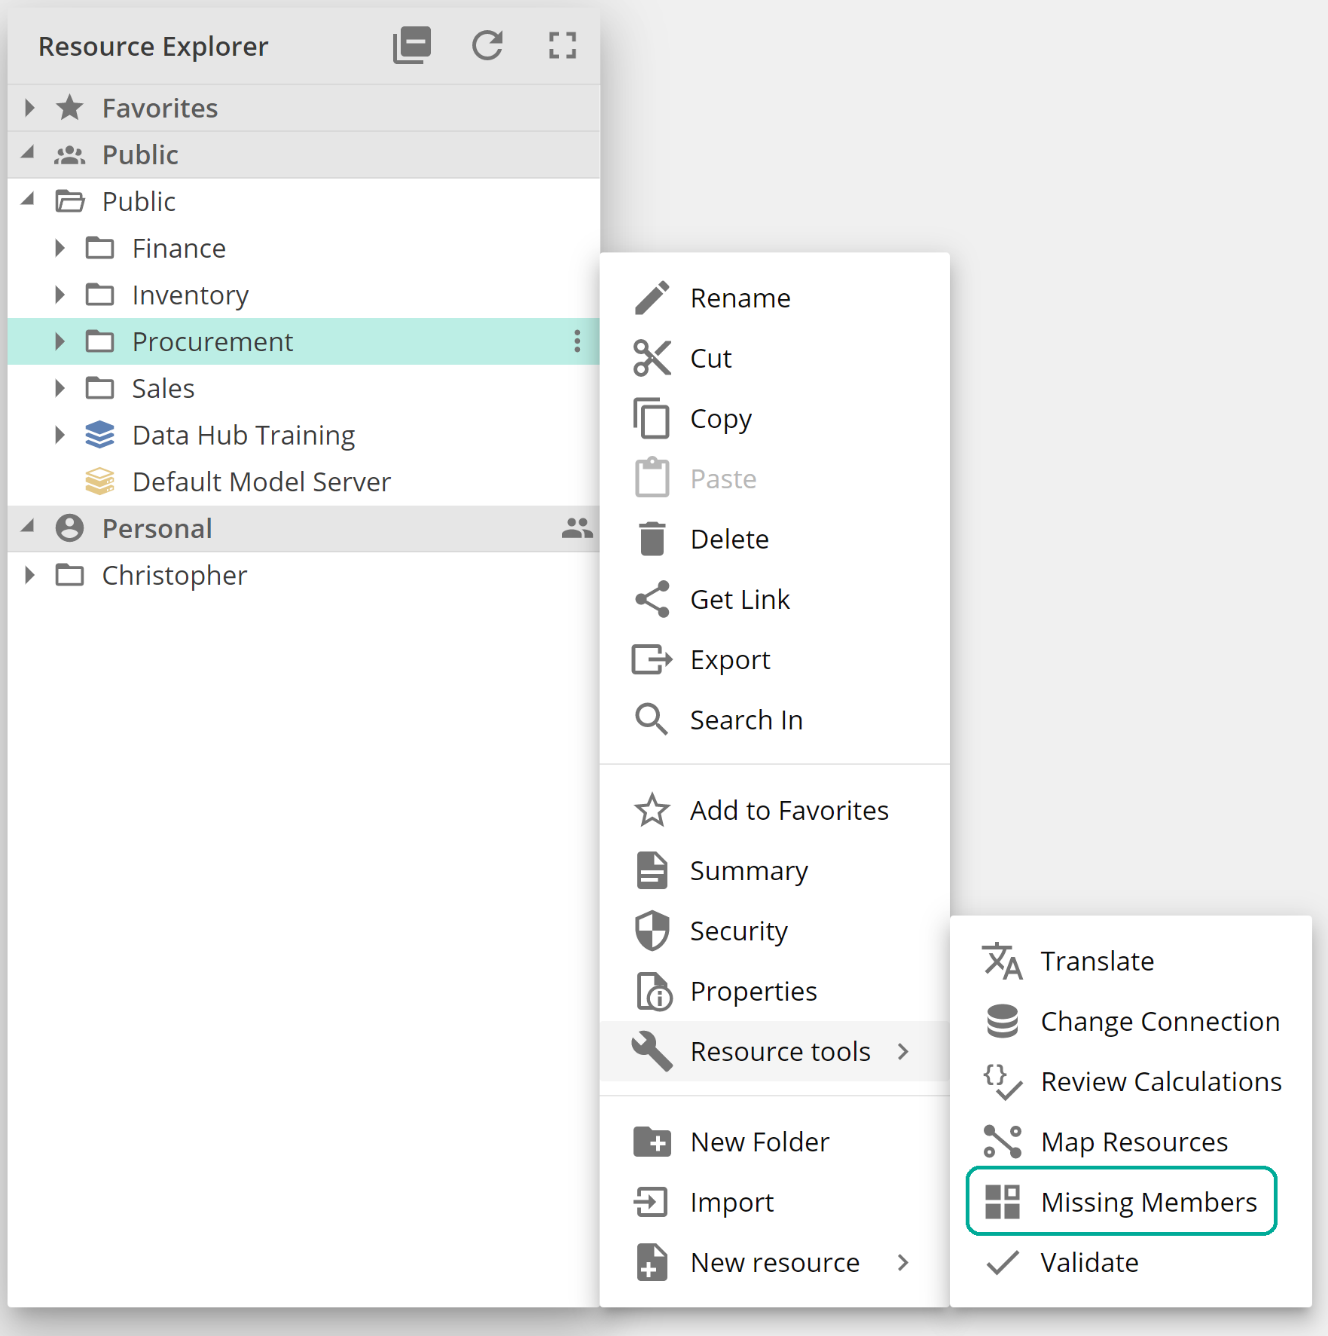 |
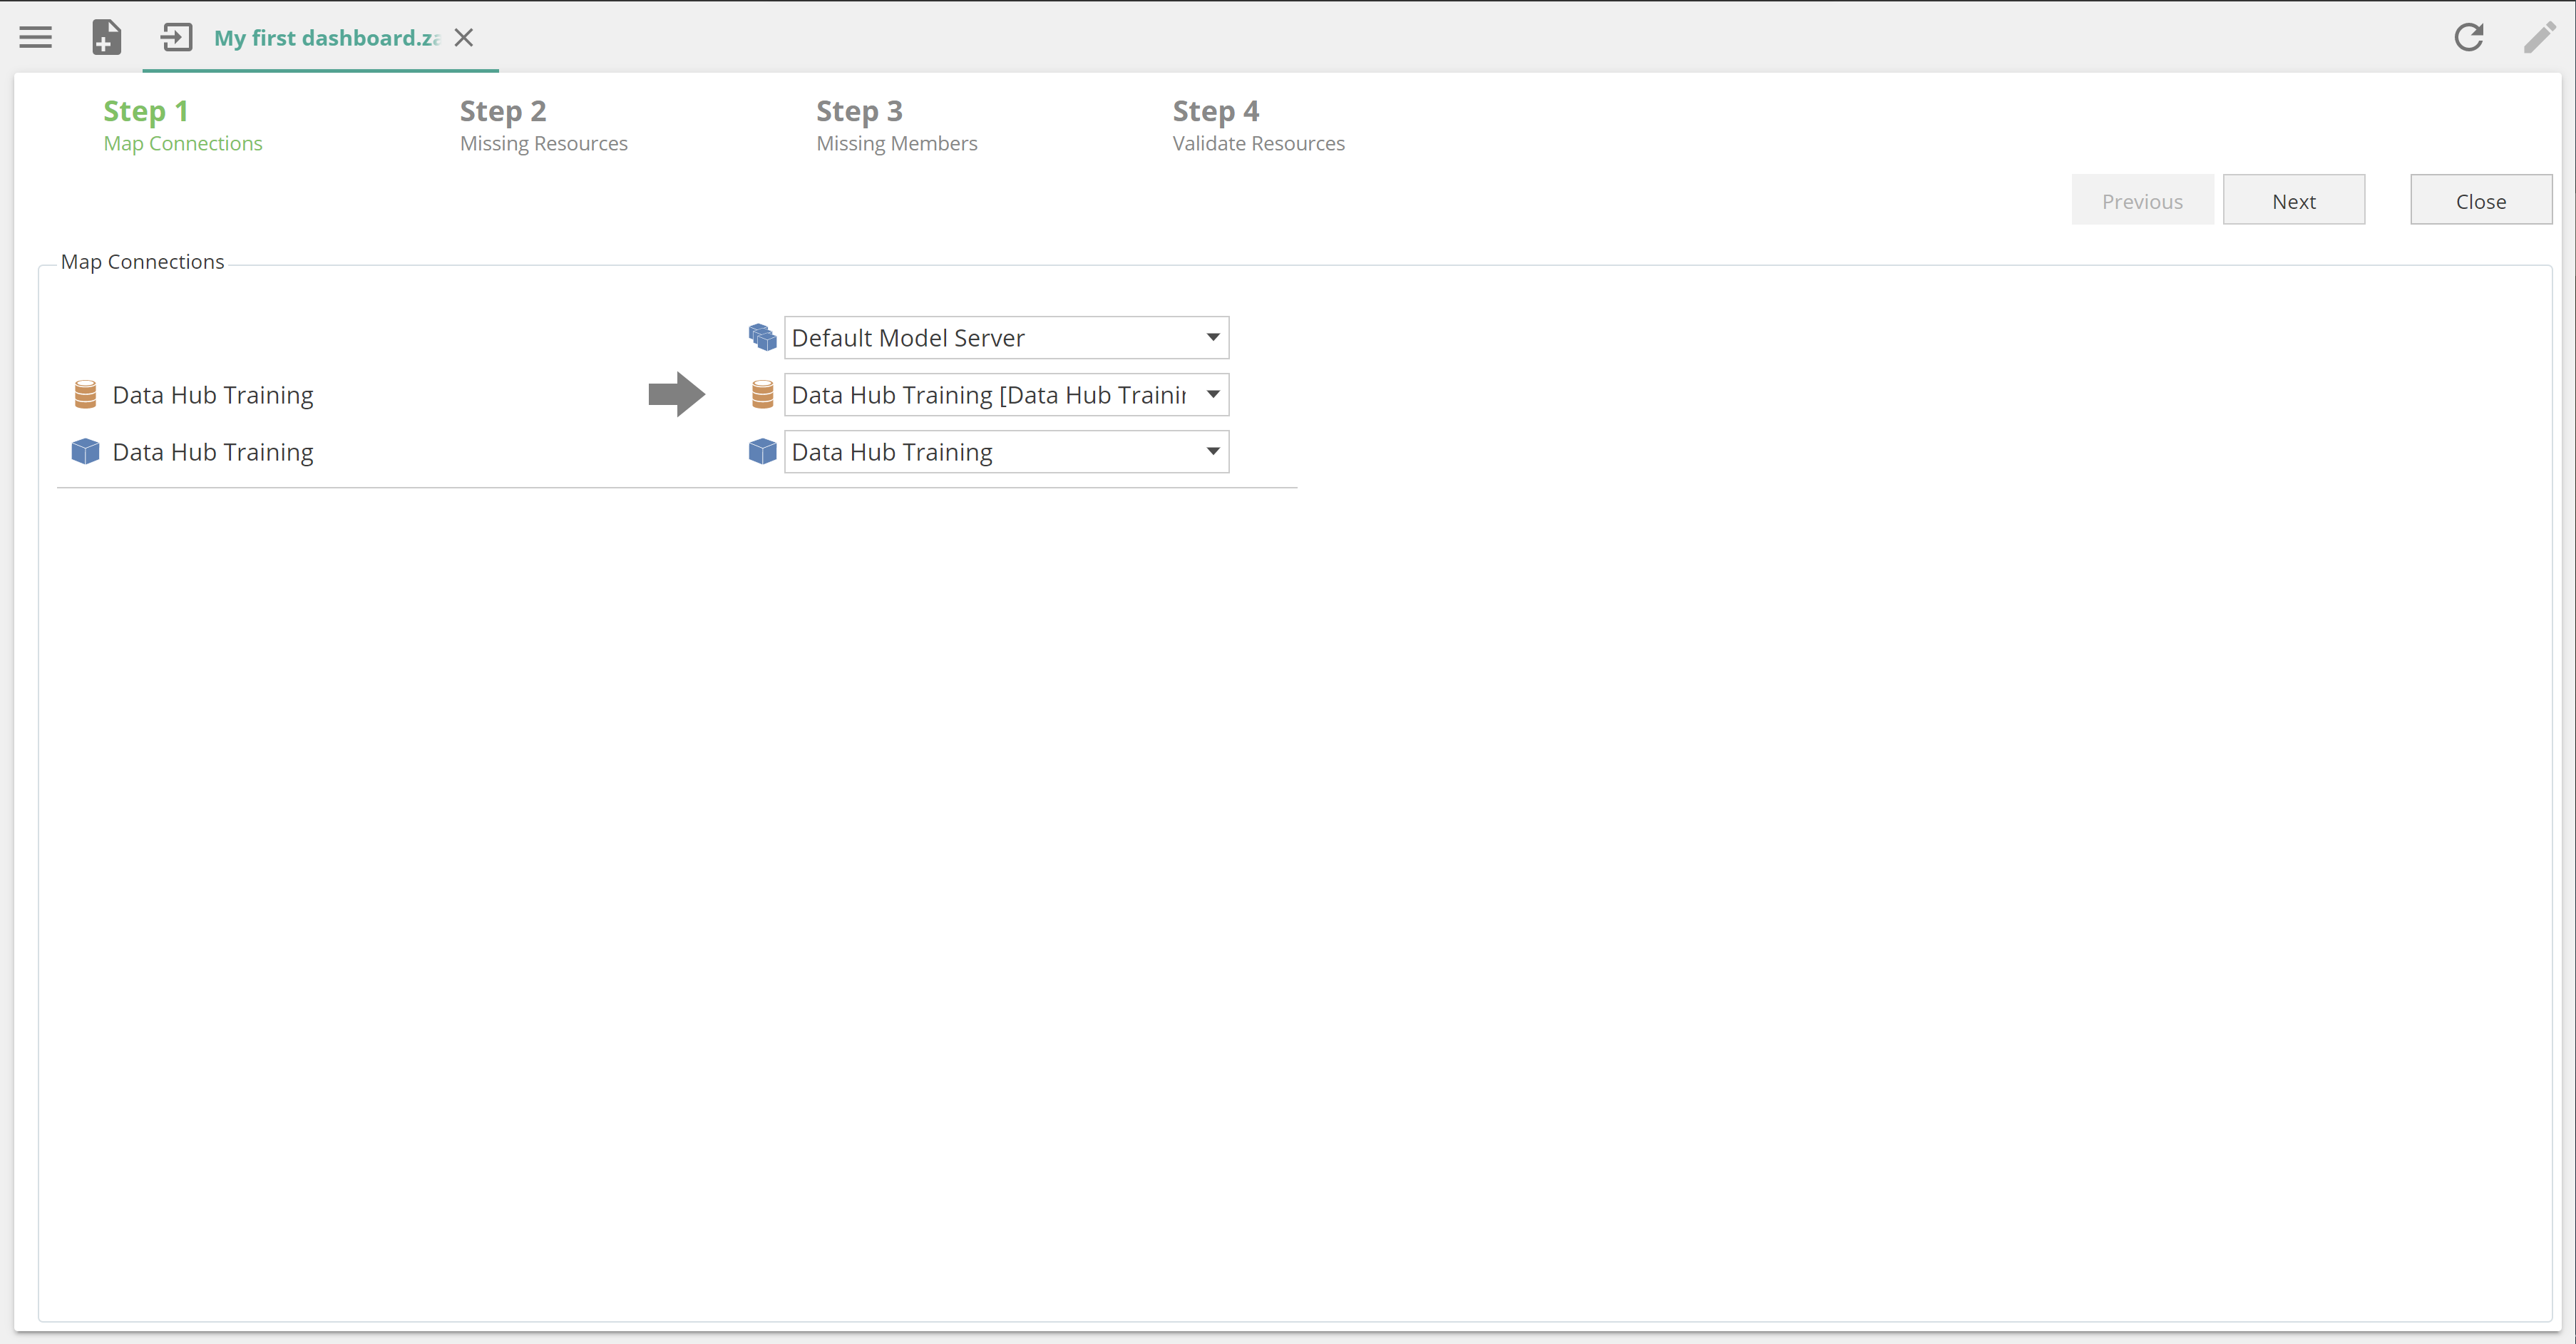
The Resource tools sub-menu provides additional tools for validating analytics from the image. The Change Connection option caters to updating the connection (data model) for an analytic (or suite of analytics). Recall dashboards may be composed of Analysis Reports, Analysis Charts, Rich Texts, and other resource types. The Map Resources option allows the analytic designer to resolve issues where any of these composing resources are missing. Finally, the Validate model ensures there are no query design issues for an analytic (or suite of analytics). It is worth noting that the Change Connect, Missing Resources, Missing Members, and Validate options from the Resource tools menu each map to a screen on the analytic resource import wizard, as in the following.
 |
We’ve just introduced the import wizard in passing. For more information on importing and exporting resources, see the Import and export analytic how-to article from the online documentation. And for more information on the Resource tools menu, including the menu items we did not discuss, see the Data Hub toolbars article from the online documentation.
Where to next?
At this point, you now have a comprehensive knowledge of analytics in Data Hub. Keep in mind the in-application hover-over tooltips as you work with the application. Where you need additional task-oriented guidance, jump into the relevant How-to articles. And for the nitty-gritty, you may refer to the reference articles. From here, we advise the following steps to ensure the success of your data projects:
Familiarise yourself with the documentation for your core Solution or Data Source. The Data Sources and Solutions documentation includes both How-to and reference material.
We strongly recommend that you challenge yourself against the complete suite of practice problems (COMING SOON).
Keep an eye out for what’s new in the product here. And finally, this is not intended as a read-once article. We strongly recommend you come back and skim this article after you have a few weeks of data modeling under your belt.
With that happy modeling!