Report packs
Overview
Report packs allow you to produce high-quality, printable reports consisting of ZAP Data Hub resources. Resources that can be bundled includes: analyses, scorecards, dashboards, images, drill-throughs reports, and rich text resources. Users can include title pages, table of contents, section breaks and images such as company logos in their report packs making them comprehensive business documents.
Section breaks
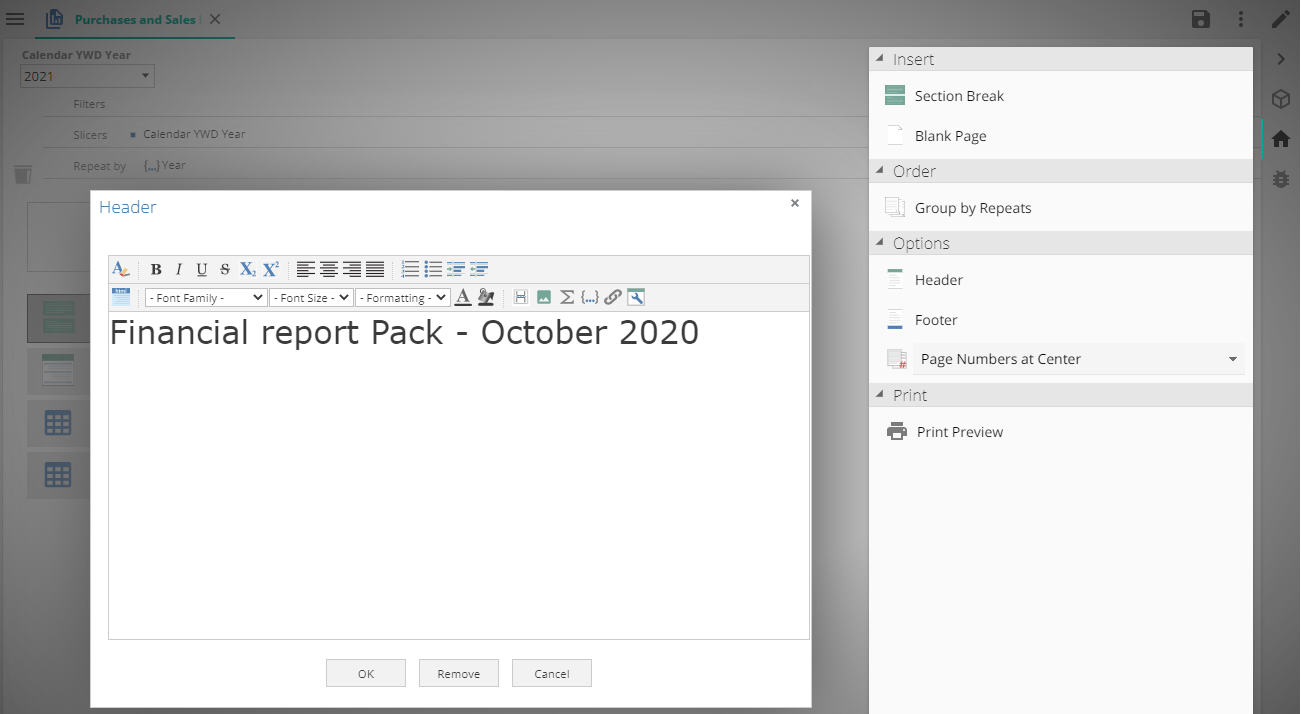
Section breaks can be used to define headers, footers, and page numbers for a section of the report.
Defined section elements (for example, a footer) are valid for the report's pages from the place where the break was inserted until the next section break is defined (similar to the section break behavior in Microsoft Word).
Report pack filters and slicers
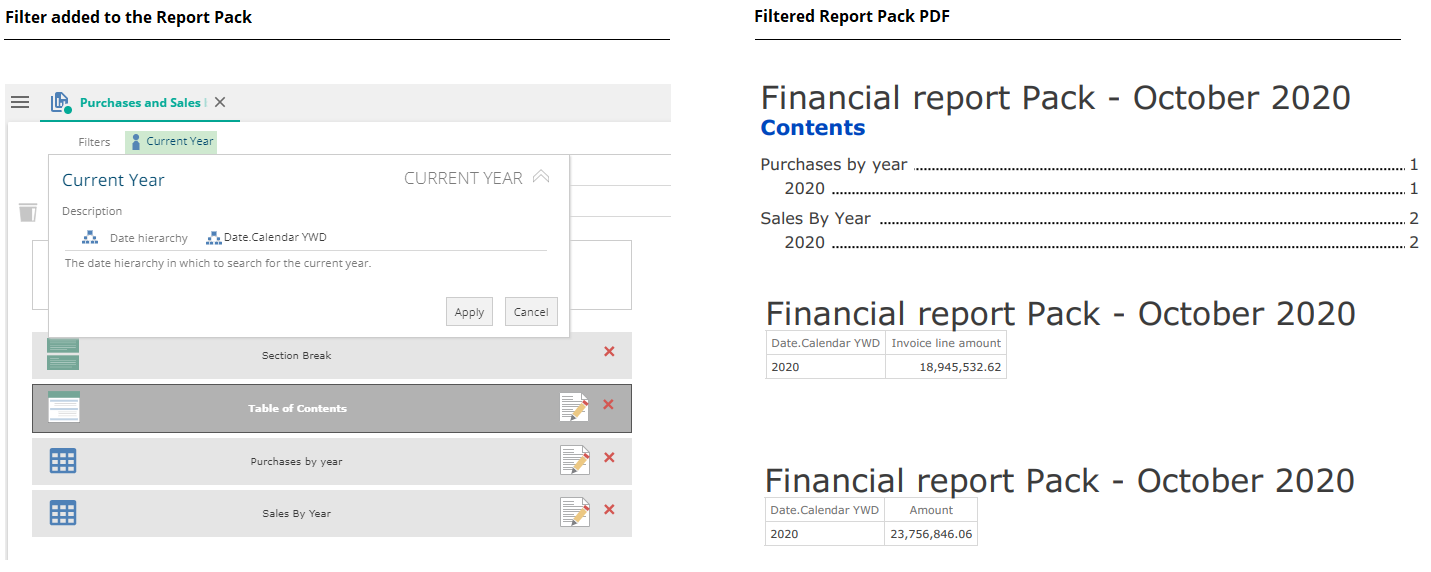
Report pack filters or slicers are optional, but can be useful when a user wants to use an existing report but tweak it slightly to suit the needs of the Report Pack.
Using an existing Sales report might show data for several countries or years. Instead of creating a new report, the designer can simply use a filter or slicer to change the report slightly to show data for specific countries or years.
Using a filter will restrict the data to the particular value of the member used, e.g. 2020
Using a slicer will give the report pack user the ability to change the year the report pack should be printed for.
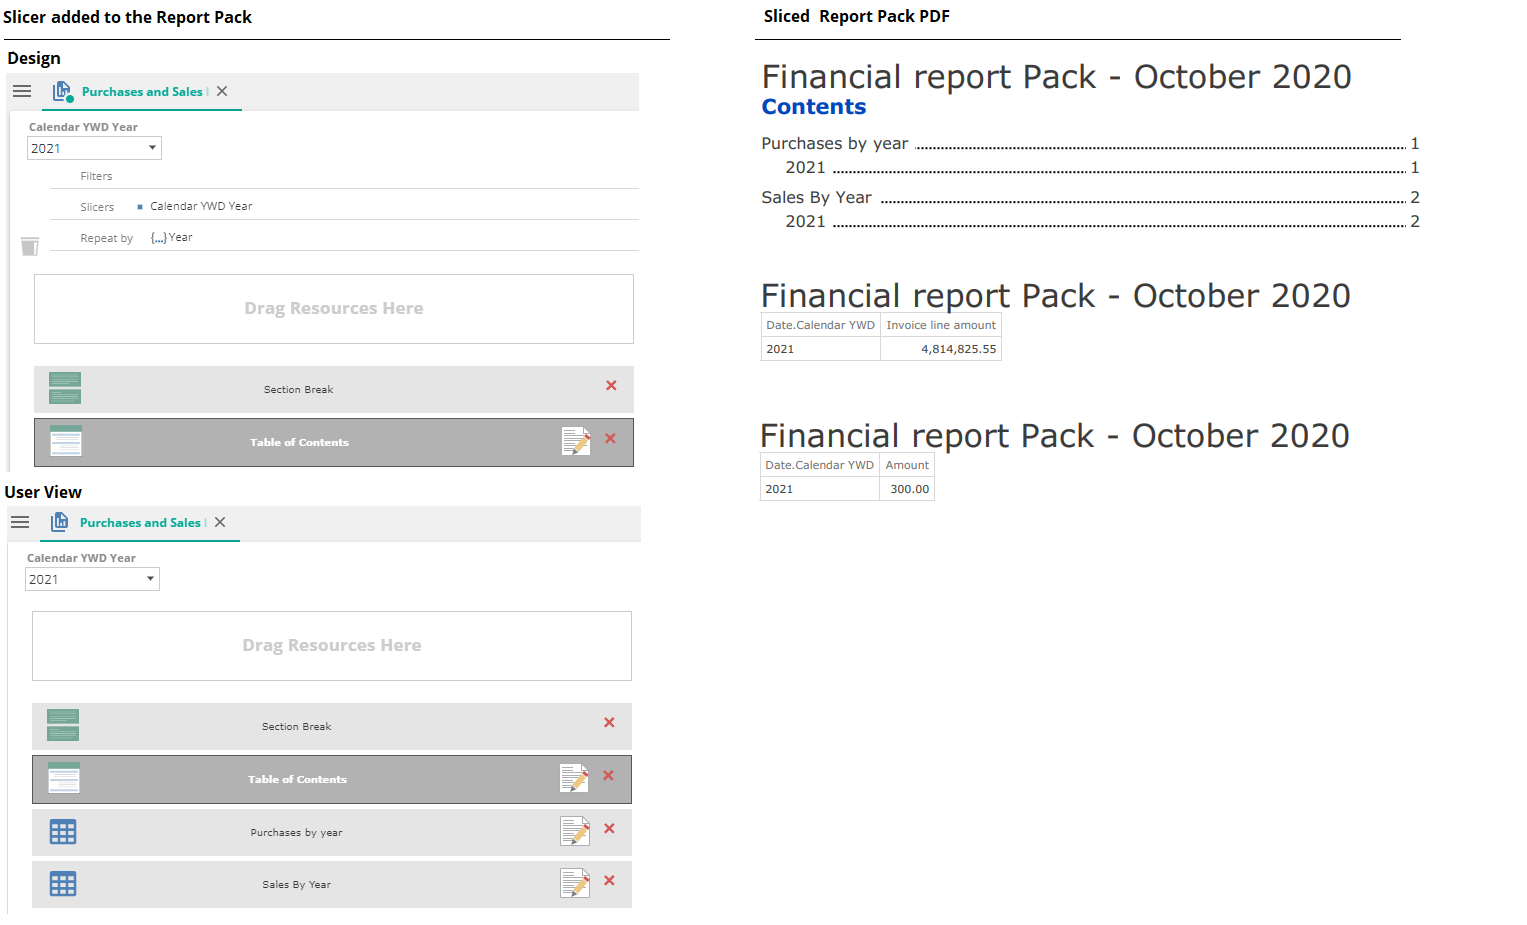
Applying a filter or slicer will limit the data in all resources added to the report pack, including calculated members embedded in rich text resources.
Grouping and repeating
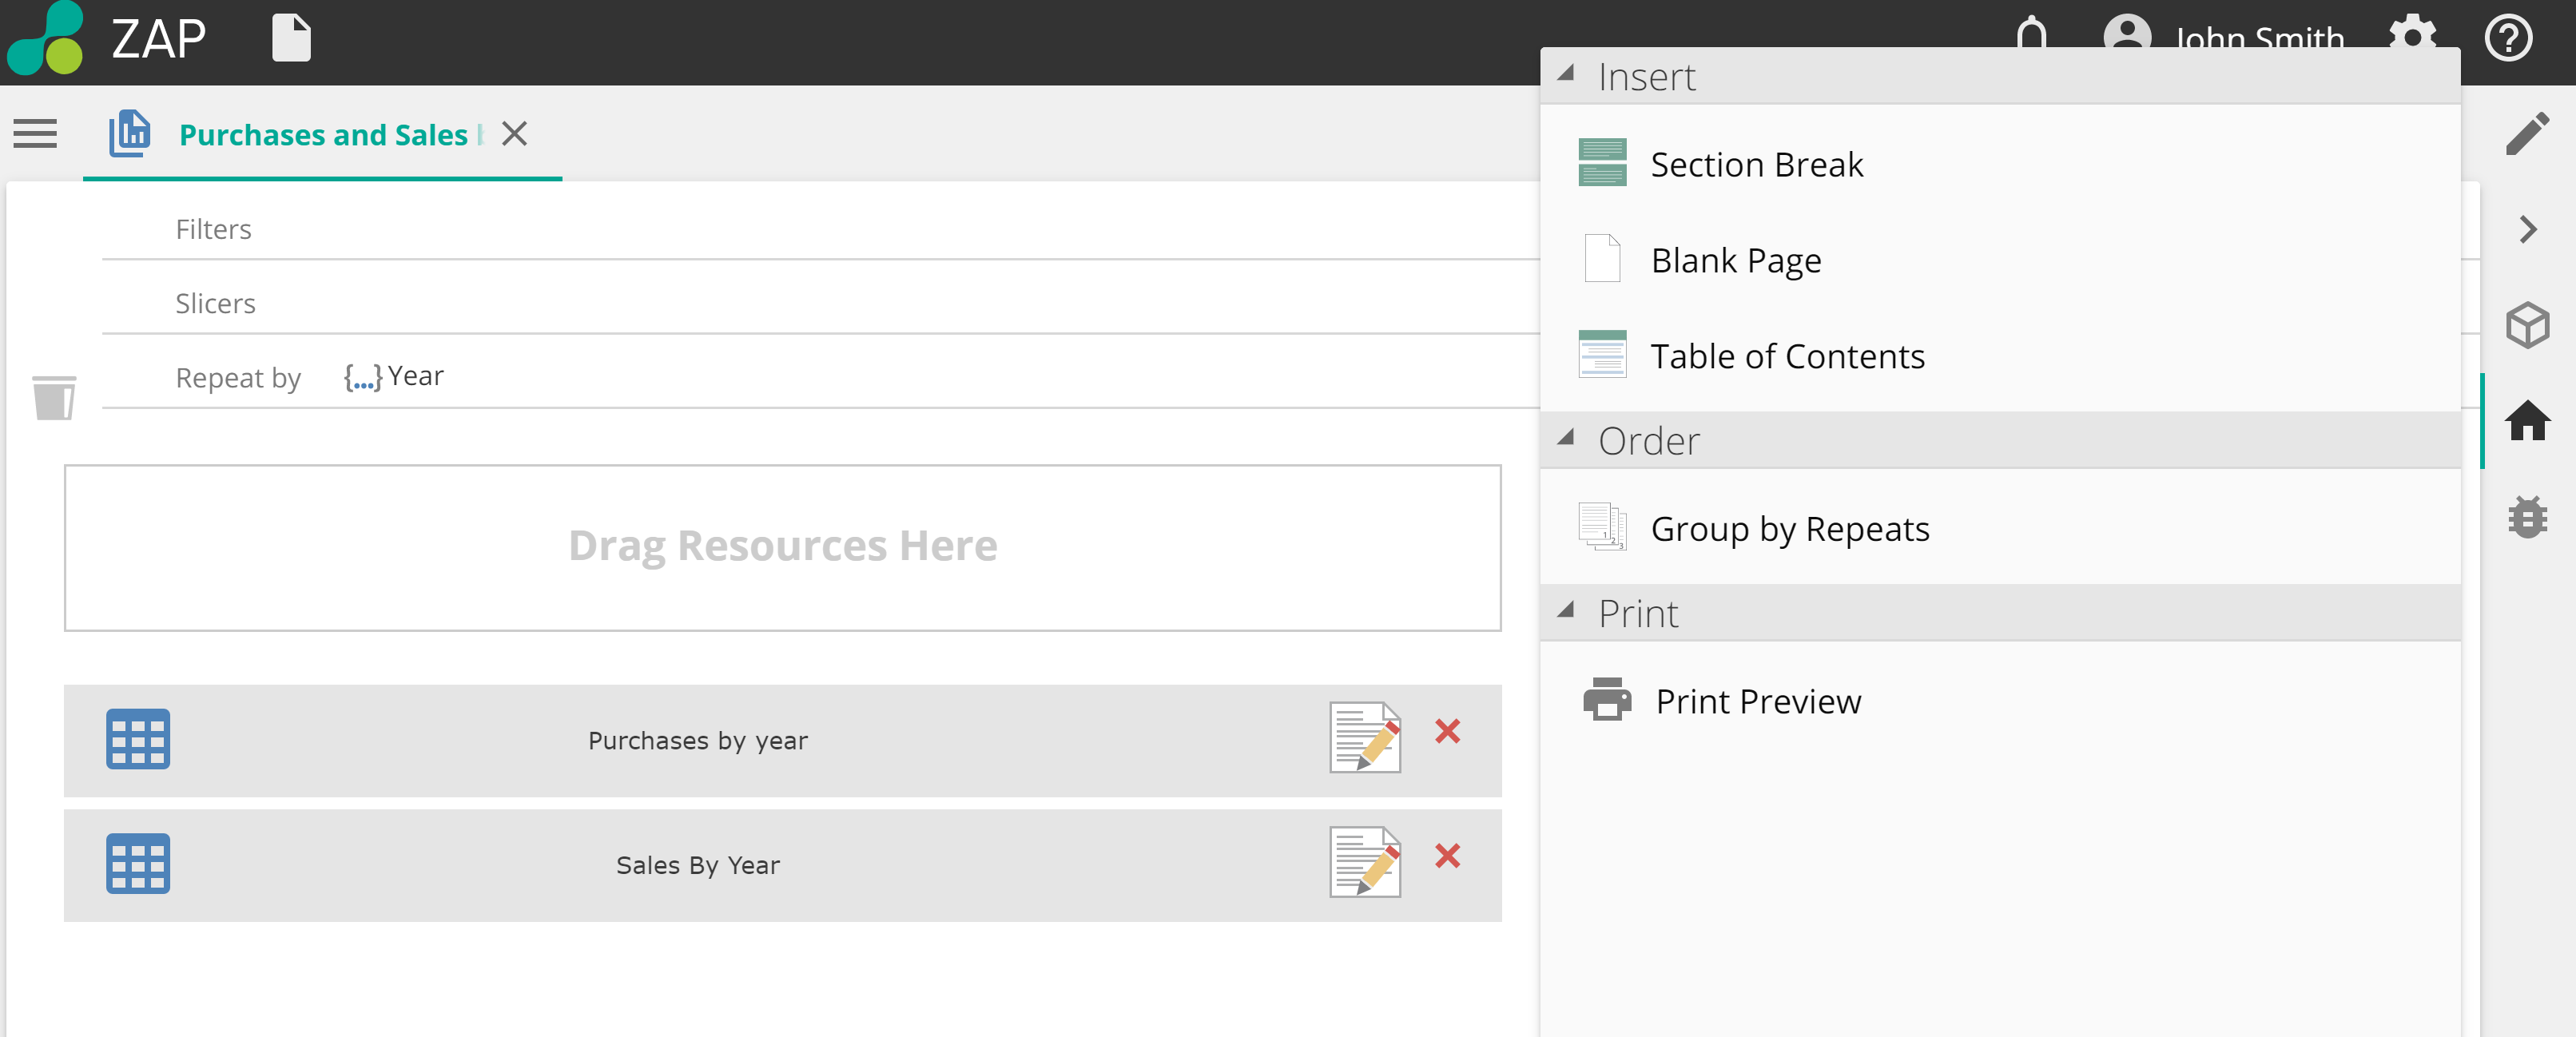
Customizing the display of report pack contents can be done by using the Repeat by and Group by Repeats functionality. When none of these options are used, the order of the display will be the sames as the order of the resources added to the report pack design.
The Repeat by placeholder is used to specify the members you want to use to order the printed report by.
The Group by Repeats button controls whether the report pack's pages are grouped by the member in the Repeat by placeholder or not.
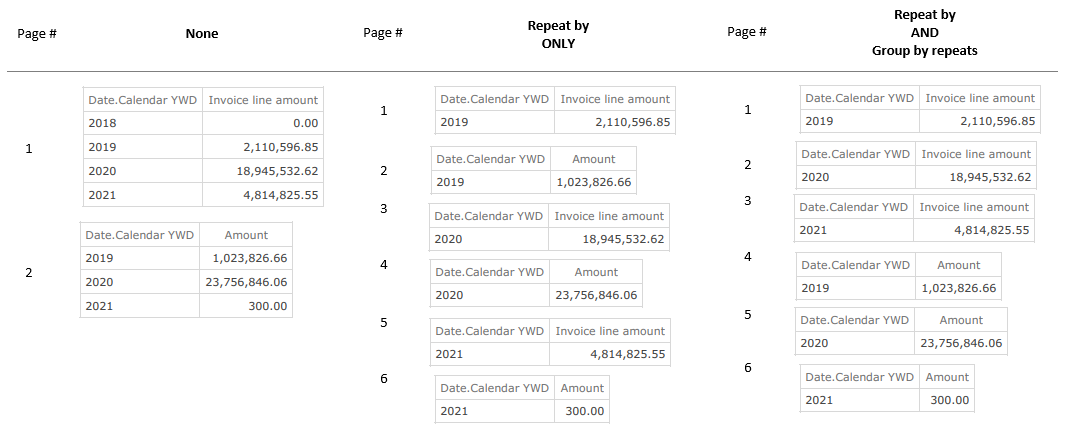
In the image below, the print format of the PDF can be seen, based on which combination of the options were used.
Option | Format of the printed PDF |
|---|---|
None | When no options are used, the report pack prints the analyses in the order they appear on the design canvas, one analysis per page. |
Repeat by Placeholder ONLY | The report pack arranges the data on 6 separate pages of the printed PDF. Each page shows an individual year's information, with purchase information being shown first, followed immediately by the same year's sales data. In other words, the pages are grouped by Year (specified repeat by member) and then by analysis. |
Repeat by Placeholder AND Group by Repeats | Again the report pack arranges the data on 6 separate pages of the printed PDF. However, unlike the previous example, all Purchase information is shown first (with one year on each page), followed by all sales information for each year (again, with one year on each page). In other words, the pages are grouped by analysis then by year. |