Data Hub 10.0 on-premises release notes
Data Hub v10
Released July 2021
What's new in this release
This release includes several new features and enhancements and some defect resolutions.
Navigate Data Hub
Data Hub portal
We continuously strive to improve and simplify navigating our portal, and to have easy and streamlined experiences when navigating around the portal.
The main portal has 3 functional areas:
TOP LEFT: Interact with resources.
TOP CENTRE: Search for resources.
TOP RIGHT: Manage Data Hub utilities and settings for the environment and personal profile.
Work with resources
Interact with existing resources
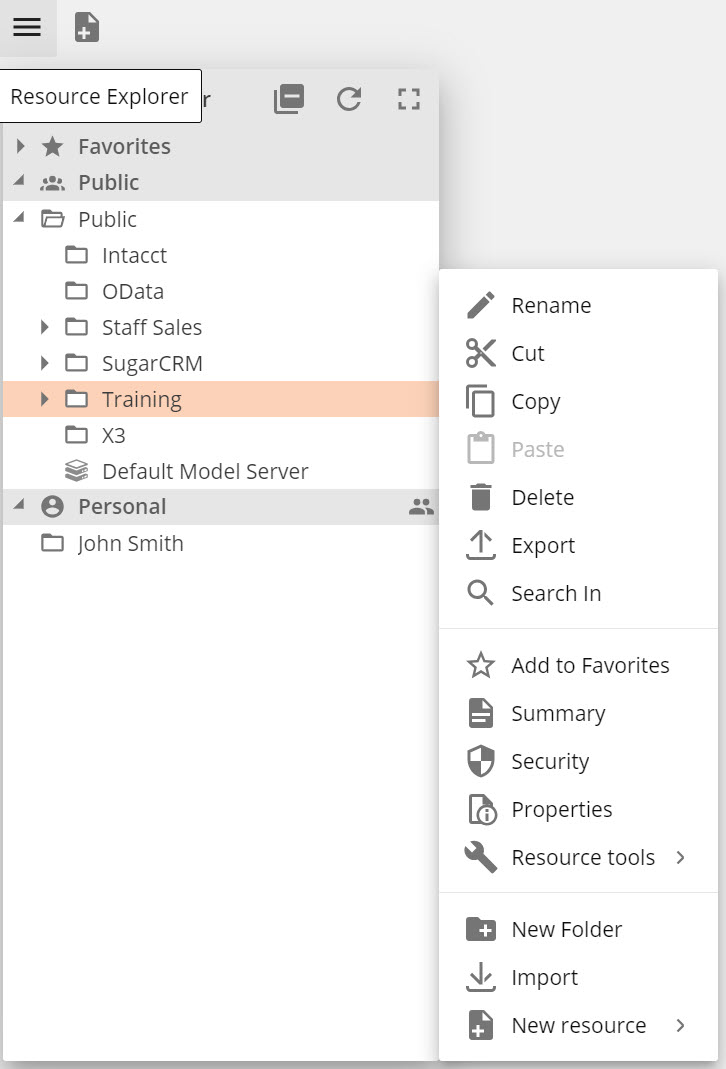
Using the Resource Explorer
Expands by default to give you direct access to the existing resource structure.
Drag, hold, and drop to move resources.
Double click to open a resource. Use shift and ctrl click as you would in windows to select groups of resources or folders.
Maximize the Resource Explorer to display more information such as Description, Last Modified by/date, and Created by/date.
A Right-click menu or clicking the ellipses is available on an resource, which gives all available functions relevant to the selected resource.
 |
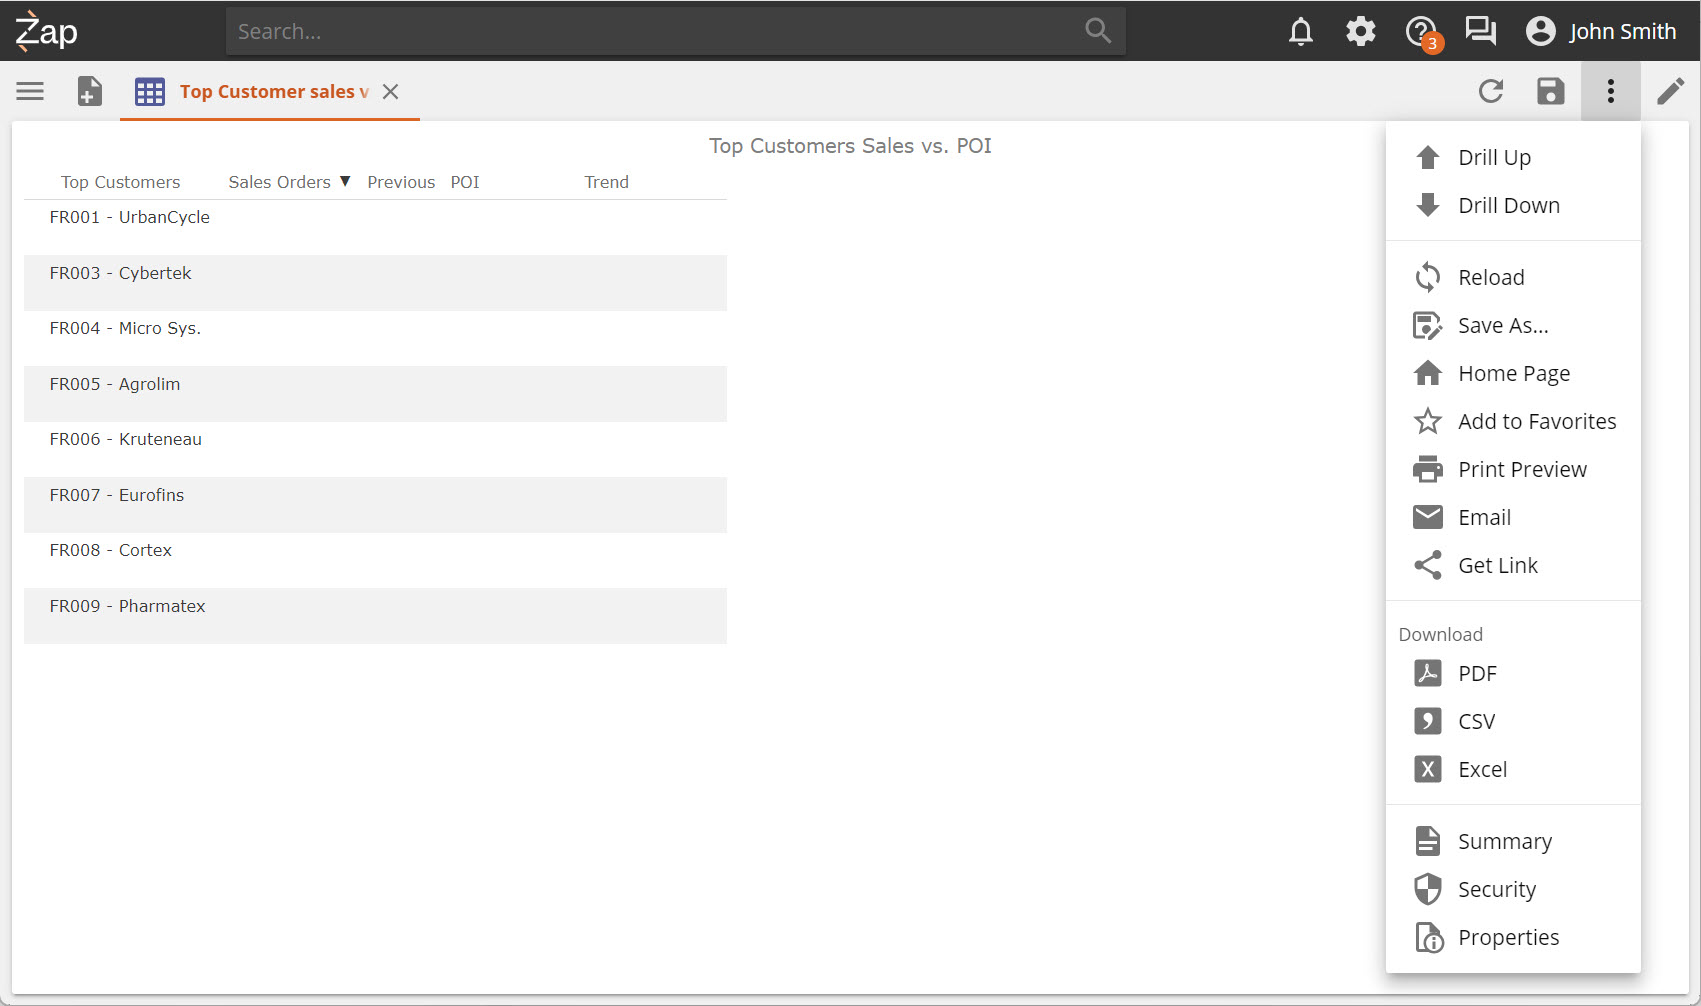
Once a resource is opened, the toolbar and options menu will provide a rich set of functions relevant to the open resource.
Detailed information is available on all the resource options and functions from the Data Hub toolbar
 |
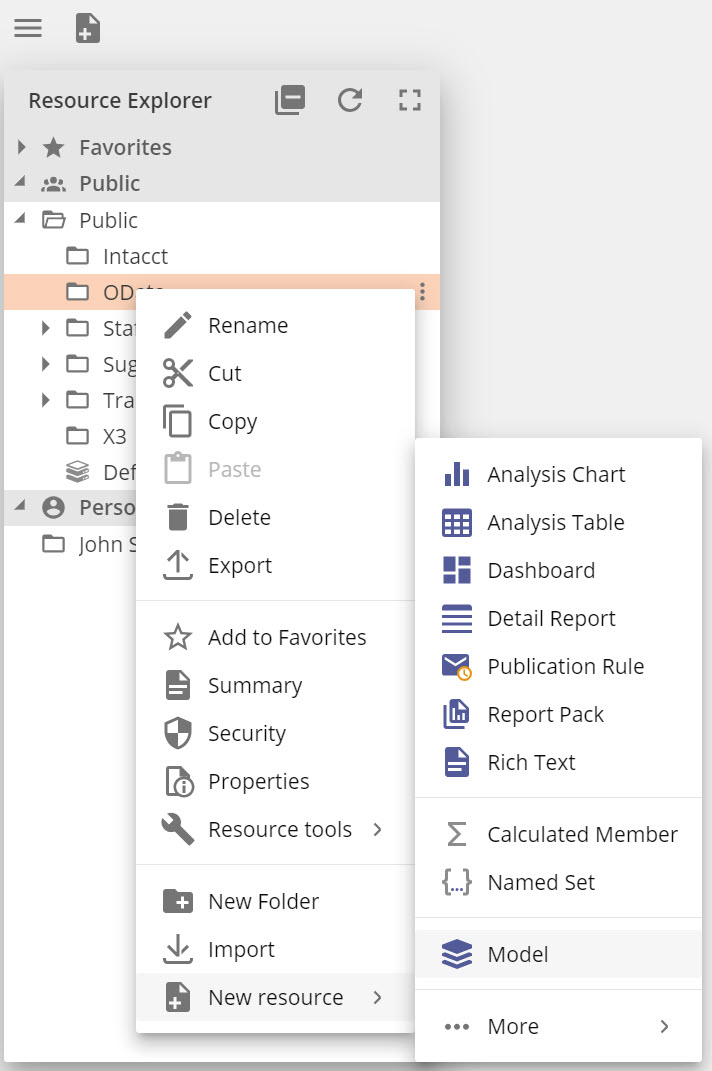
Create new resources
Create any new resource via:
Clicking on New resource, or,
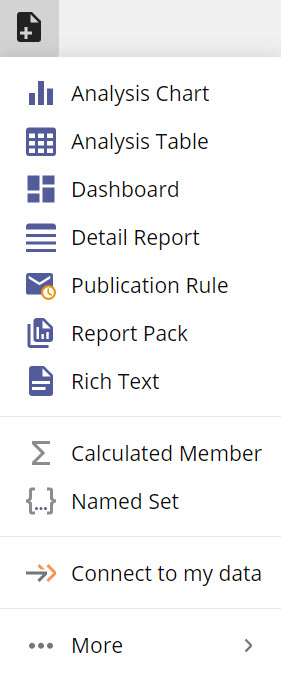
Right click inside Resource Explorer and adding a new resource directly to a folder.
Design new resources
Designing resources can be divided into two main categories:
Analytic resources. In design mode, a vertical design panel appears on the right of the screen, with tabs containing relevant functions for the open resource.
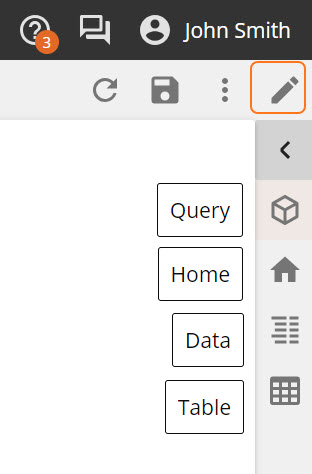
Modeling resources. When designing a data model and its components, all functionality is available through the Data model screen. Based on the elements you are working on, a design panel will become available with relevant function sections.
Detailed information is available about interacting with model interface elements. In addition easy instructions are available for How to work with the modeling elements, supplemented by in-depth modeling reference explanations
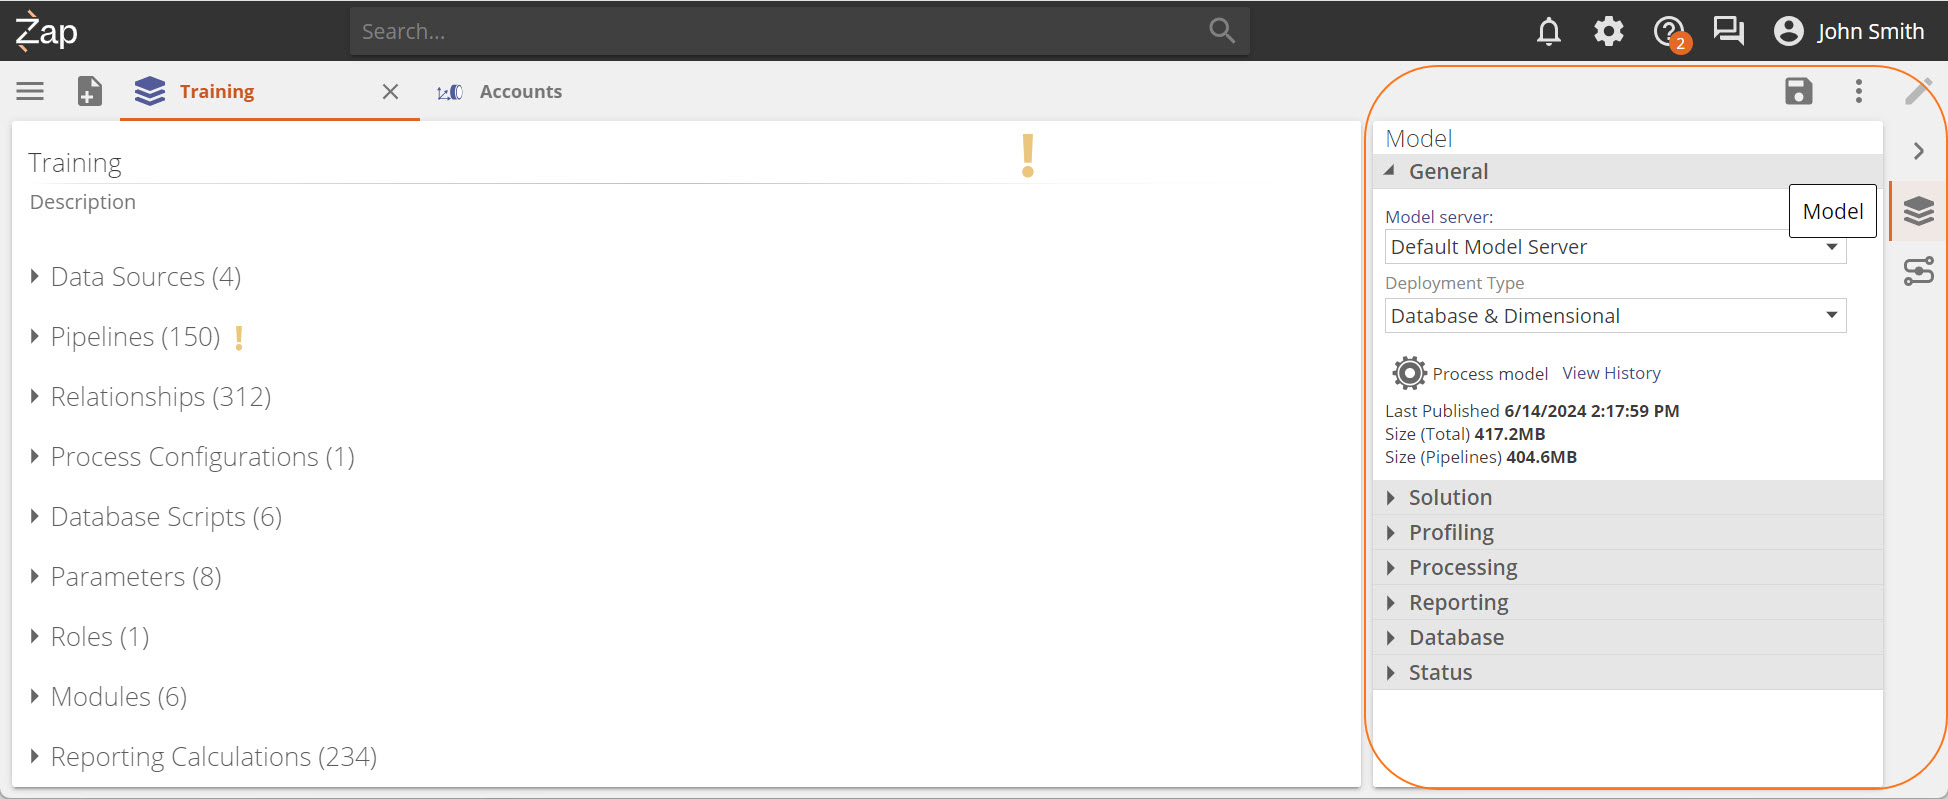
Model design panel
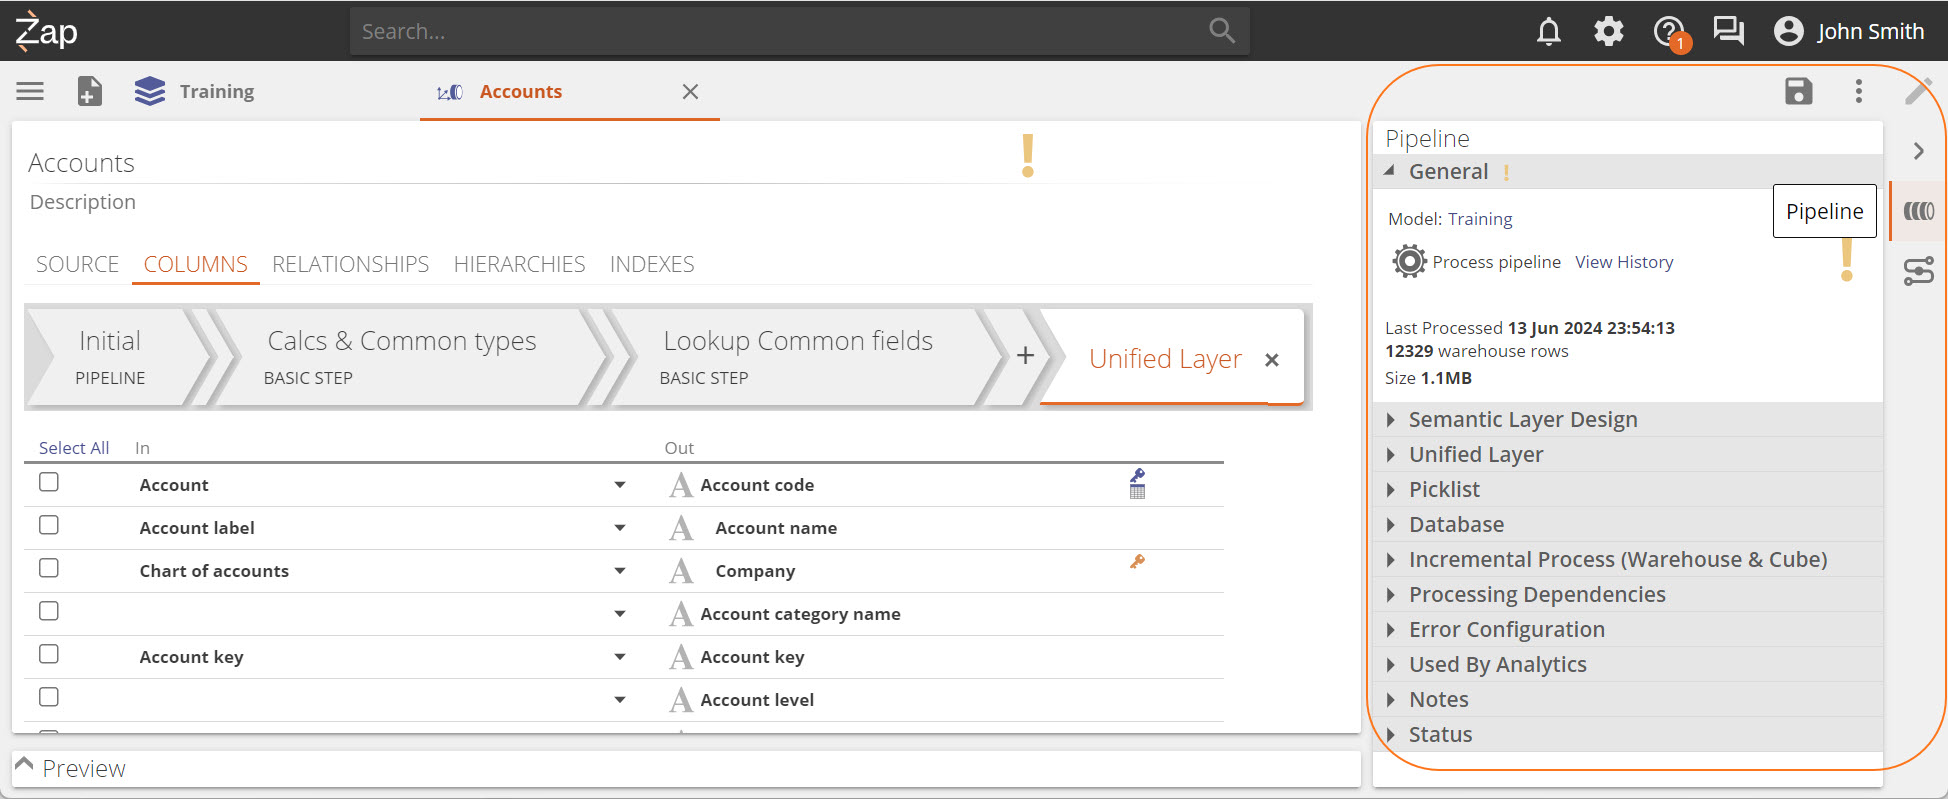
Pipeline design panel
Search
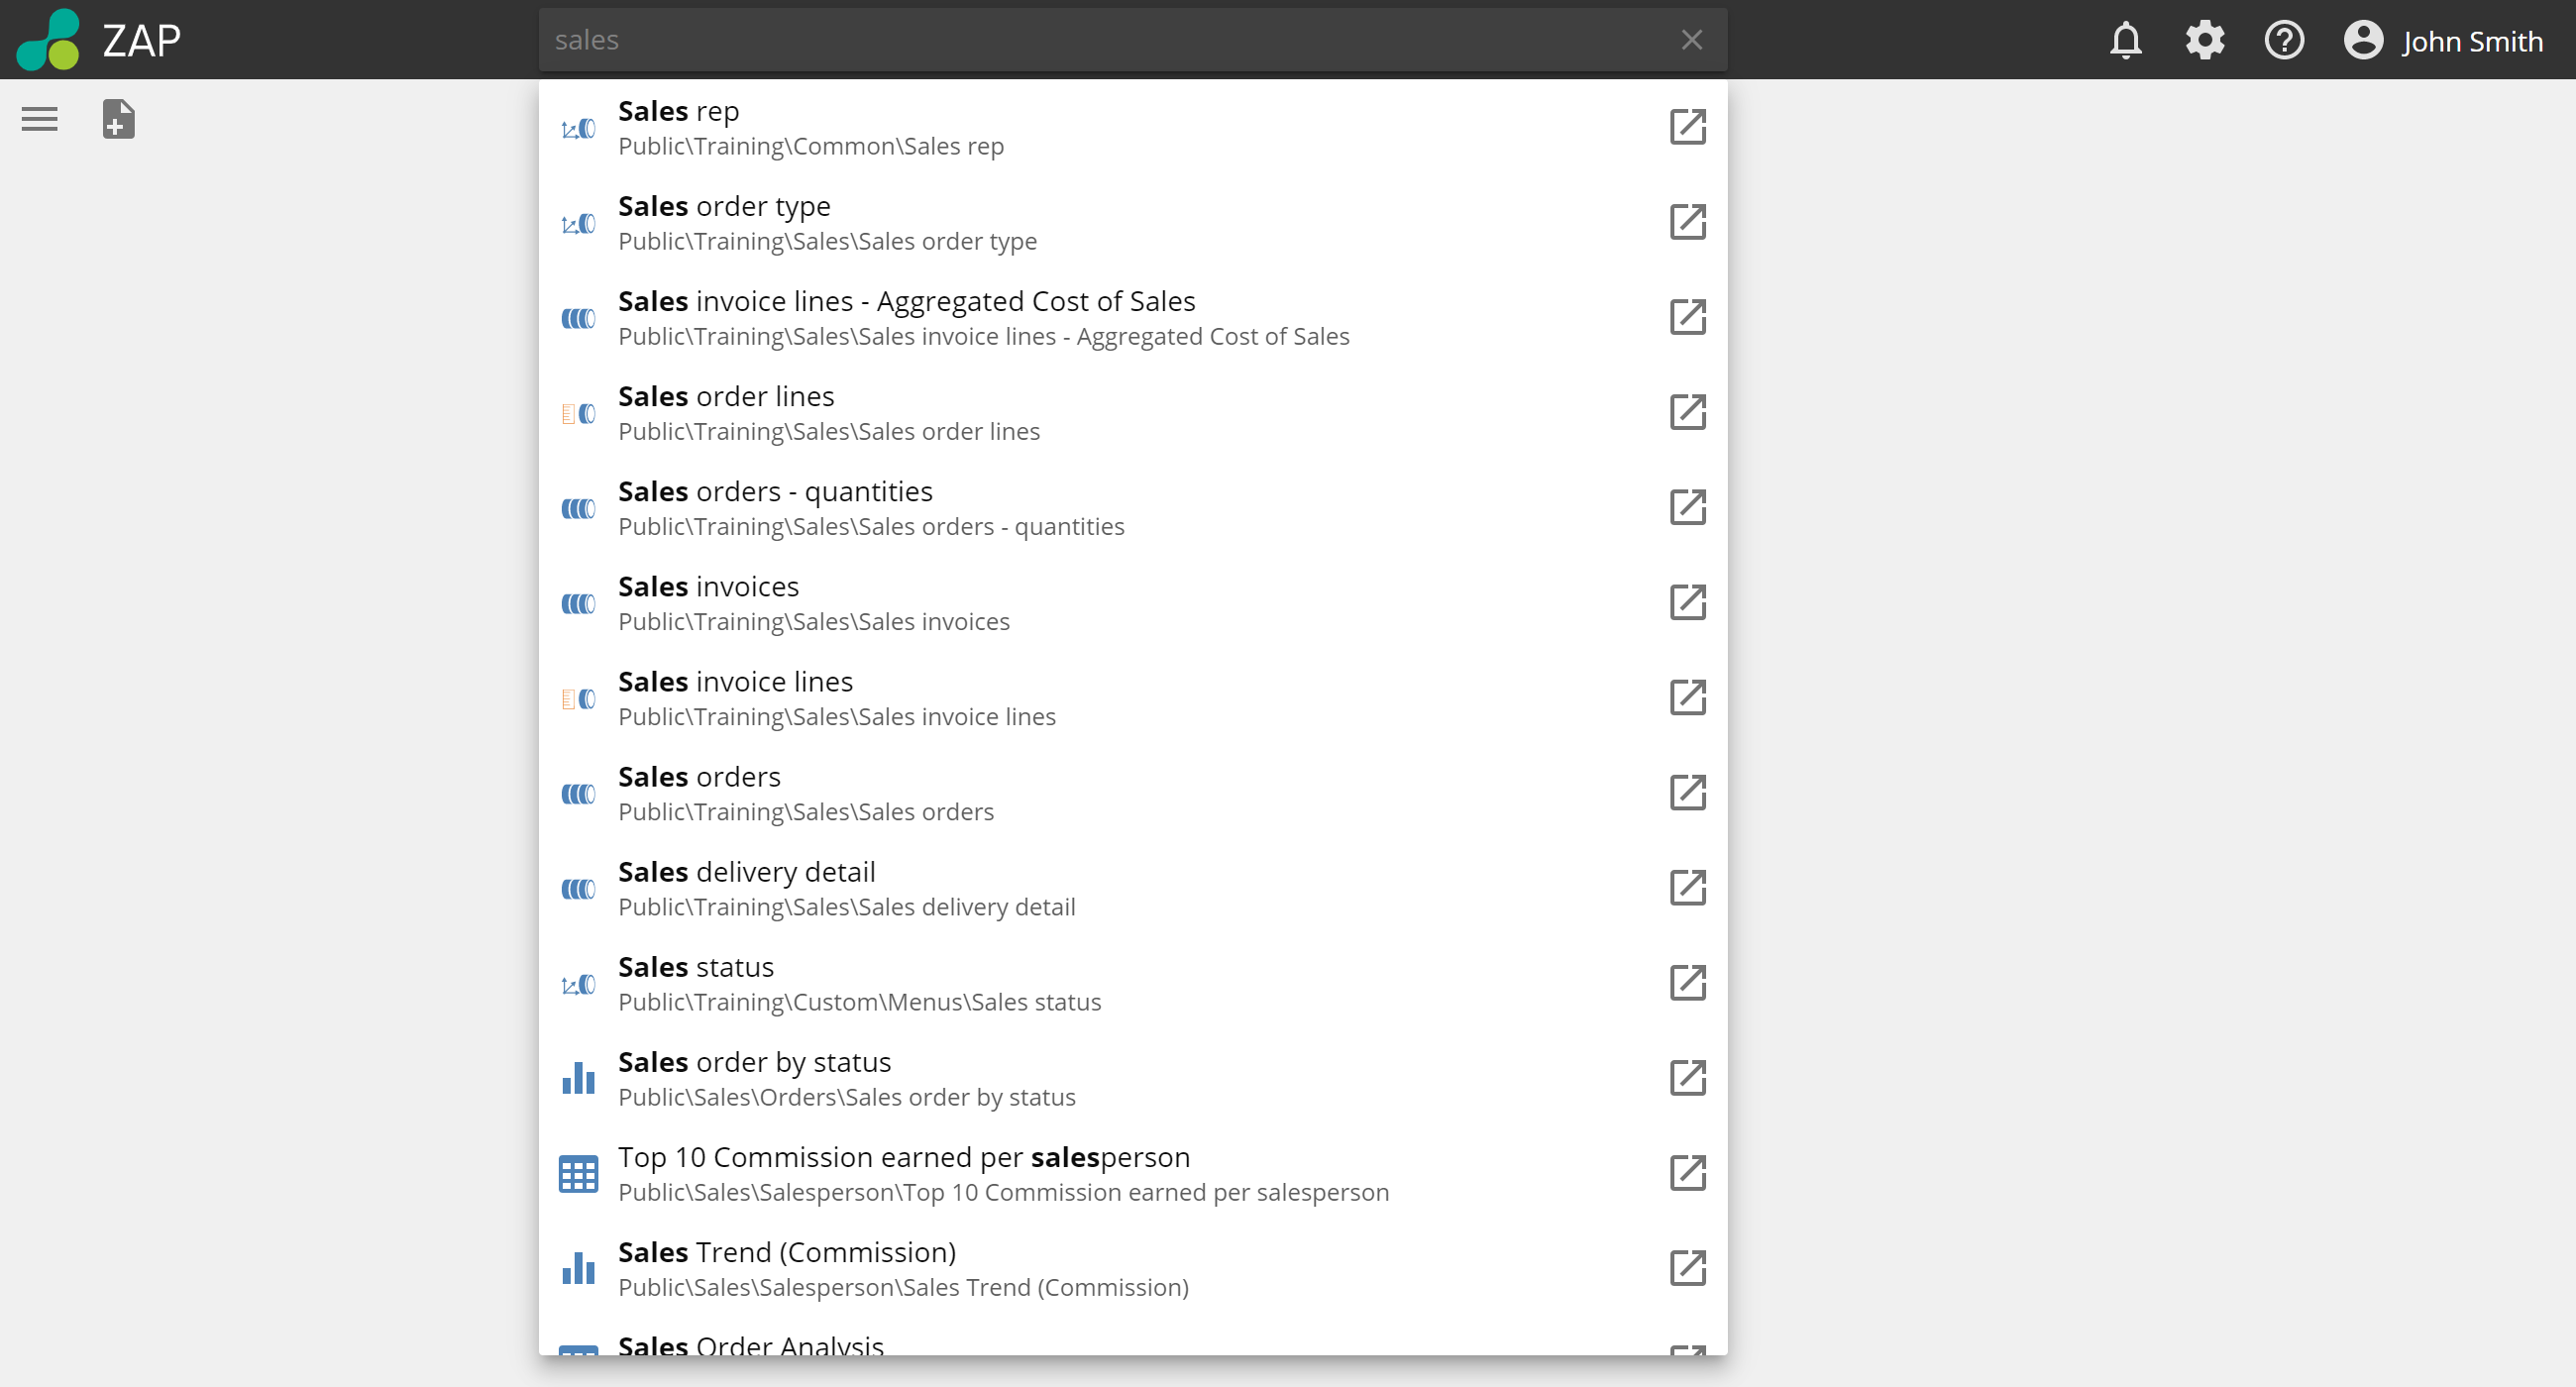
Resource Search is centered in the Title bar for optimum usability and accessibility. When not selected, its background color is dark.
To search:
Start typing the name of the resource you are looking for in the search bar.
Clicking on a result opens the Resource Explorer and focuses on the selected resource enabling more actions.
Clicking on the icon to the right opens the resource.
 |
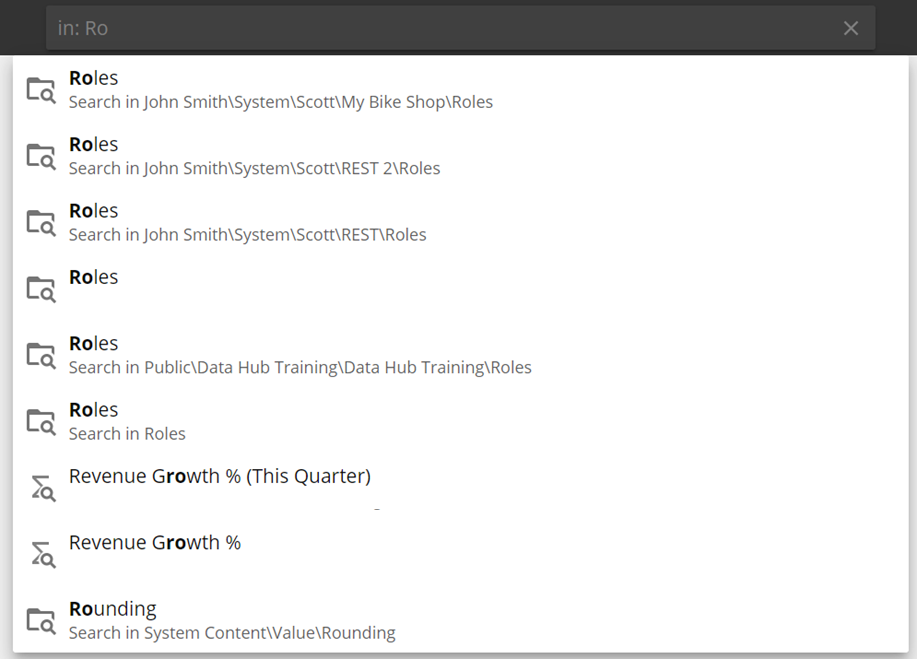
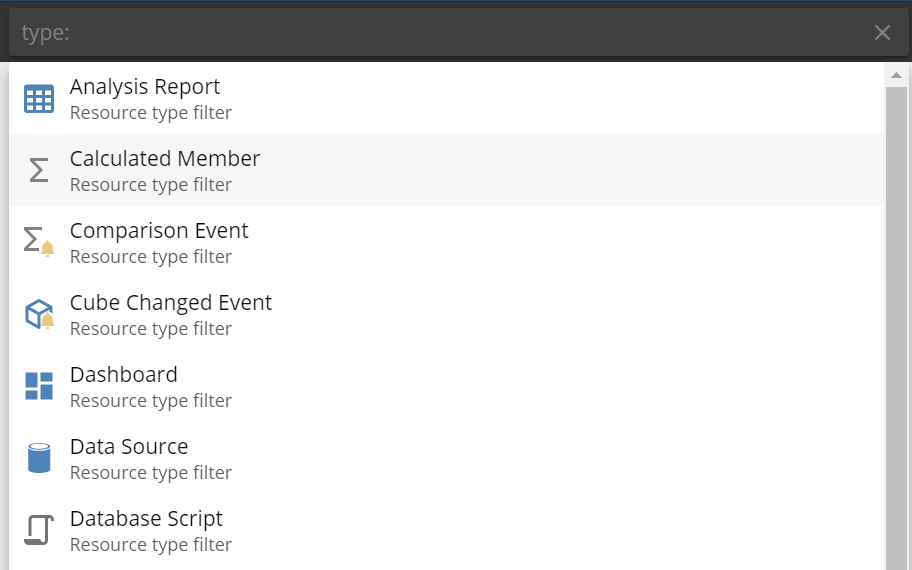
Search filters
By adding filters to your search terms, you can focus your search on only those areas you want. Type the search filter and the resource to return your results.
Search filter | Function | Example | |
|---|---|---|---|
in: | Searches within a parent folder or model. |
| |
tag: | Searches within resource tags that are applied to resources. |
| |
type: | Searches for a type of resource. |
|
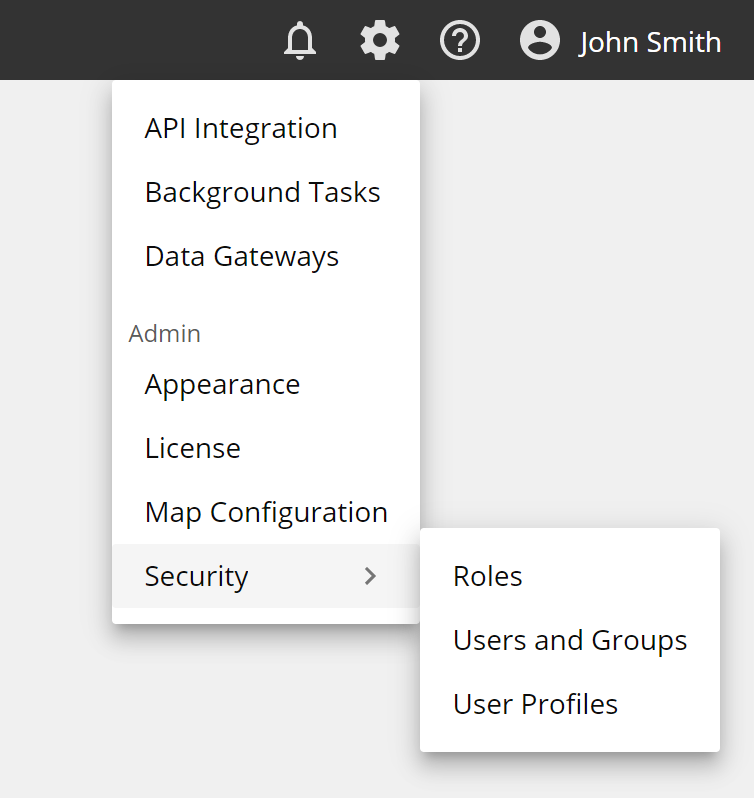
Settings and Utilities
Notifications will show any system notification e.g. when the system goes down for updates.
Settings for the application is available in a simple drop-down menu that displays over resources and allows you to open multiple settings pages as separate tabs. The options displayed will depend on the assigned role of the user.
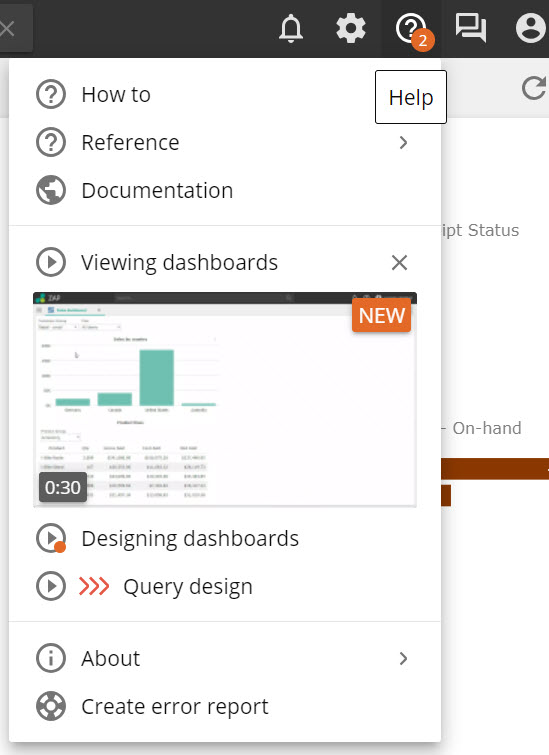
Help provides links to online documentation and shows In-app videos and tutorials to guide you on completing tasks.
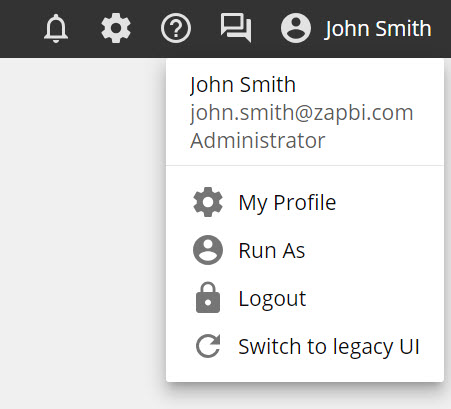
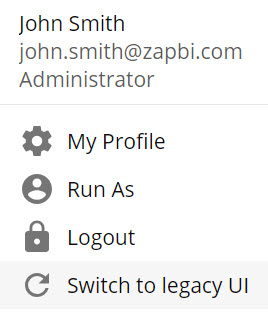
Profile allows you to edit your own profile, use the "Run as" function, logout or change to the legacy UI.
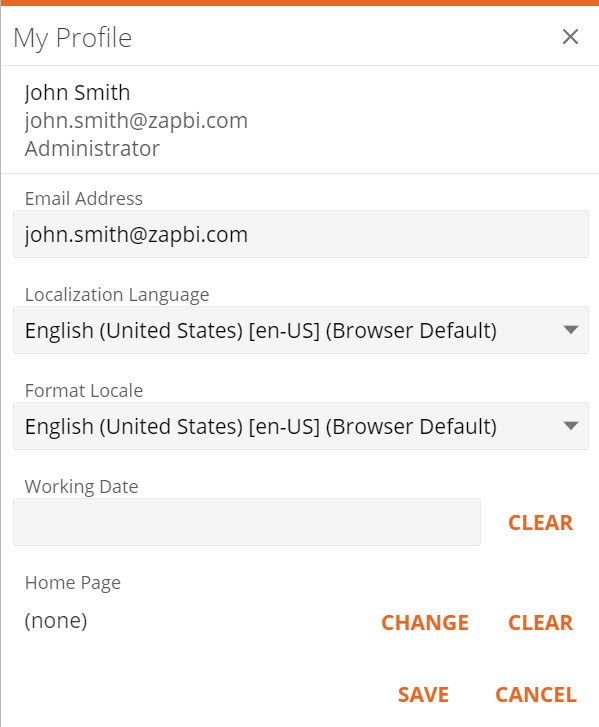
Selecting My Profile will open a pop-up where you can edit your personal details.
Switching between the old and new UI is easily done by using the provided links. Switch to new UI in the title bar of the old UI, or Switch to legacy UI in the User Profile Dropdown of the new UI.
Reporting
The following changes have been made to the reporting functions in Data Hub.
Waterfall chart type
The waterfall, also known as a bridge or cascade chart, portrays how an initial value is affected by a series of intermediate positive or negative values. Usually, the initial and the final values (endpoints) are represented by whole columns. In contrast, the intermediate values are shown as floating columns that begin based on the value of the previous column. The columns can be color-coded to distinguish between positive and negative values.
Create a waterfall chart
Click New resource > Chart.
Select the cube details and click OK.
Click Chart Type and select either Column Waterfall (vertical axis) or Bar Waterfall (horizontal axis).
Drag measures to the Series and Bars placeholders.
Note
There are three color codes on the chart: Green indicates an increase. Red indicates a decrease. Blue indicates the total.
Click Save.
Select a location to save to, name the chart and click OK.
Changes to User Profile Views
Some time ago we introduced the Viewer profile so users who do not need to perform any other functions can simply view reports. With v10, we have now merged the Viewer and Consumer profiles providing improved security, easier less confusion.
Simplifying Time Functions
We have made some changes to the Time functions that will simplify their use.
We:
Removed Last Complete and Most Recent Period folders and their functions from inside Current Period.
Renamed Relative Time to Time Functions.
Moved Context Period to the main menu.
Renamed Prior Period to Parallel Period.
Removed Parallel Period function from the four existing functions and instead added a Lag.
Moved Full Period folder functions to the main menu.
Removed all <> Full (value) functions.
Removed "Member" from the end of four existing (member) functions.
Moved all existing functions to a new Utility folder, except:
Last Complete Period(s) - this has been removed.
Most Recent Periods(s) - this has been removed.
Period to Date members - this has been removed.
Period on Period Grown - keep, but it should have a Formula field for consistency.
Modeling
The following changes have been made to the modeling functions in Data Hub.
Cancel Preview queries
To run a query in the preview pane, you click the Execute button, however, if you wish to cancel the query, it was not previously obvious how to perform this.
In this update, once you have clicked Execute, the button text will now change to Cancel so it is clear that this cancels the query.
Process offline data sources without testing the connection
For users who have multiple data sources, clicking the Test Connection button sometimes encountered an offline data source which prevented the data modeling process from completing.
This issue has been corrected by allowing the data model process to ignore any offline data sources and complete the process.
Business Central data source - source filtering support
We have added support for OData filtering (timestamp for incremental loading and also custom date columns, for only migrating 2 years) for our Business Central cloud data source.
Optional only process sequentially
Users now have the ability to force sequential processing on multidimensional cubes (instead of parallel processing) by clicking Force Sequential.
Pipeline performance improvements
We have made some improvements in the background that enable faster processing of pipelines.
Gateway improvements
In previous versions of Data hub, whenever gateway updates became available, customers were required to download the new gateway installer and rerun it on the source server. From v10 we have improved this experience by enabling the gateway to update itself. Once a new update is available, it will automatically update the gateway the next time it is used, e.g. when a model's connection is tested. In order for the new v10 gateway update to function, it requires Microsoft .Net Framework 4.8. This does require a once off manual installation on the gateway host.
Licensing changes in v10
Our back-end licensing service was upgraded to a platform that better serves our cloud and on-premise customers, and in addition accelerate our provision process. This is a transparent change to our customers.
From v10, we will now license two main types of users namely: Designers and Consumers. This change will better reflect ZAP's subscription plans and reduce confusion.
Administrators will still be treated as elevated Designer licenses.
Viewers were introduced to simplify accessing analytics without requiring users to be added. Although helpful, it also caused confusion. Viewers are deprecated from v10, but Zap is replacing the viewer users with Consumer users.
We recommend that you use Active Directory Groups in ZAP to avoid manually adding many users within your organization.
Anonymous Analytics access was tied to the viewer license and is also deprecated.
For more detailed information about these License changes refer to ZAP data Hub v10 Licensing Changes
Additional release information
Note
Accessing Knowledge Base articles may require that you log in to the Data Hub Support website.
Corrected defects
This Knowledge Base article provides a notable subset of the defect resolutions.
Upgrade instructions
For instructions on upgrading Data Hub, see: Upgrading an Existing Data Hub Installation.