Consuming Data Hub Analytics
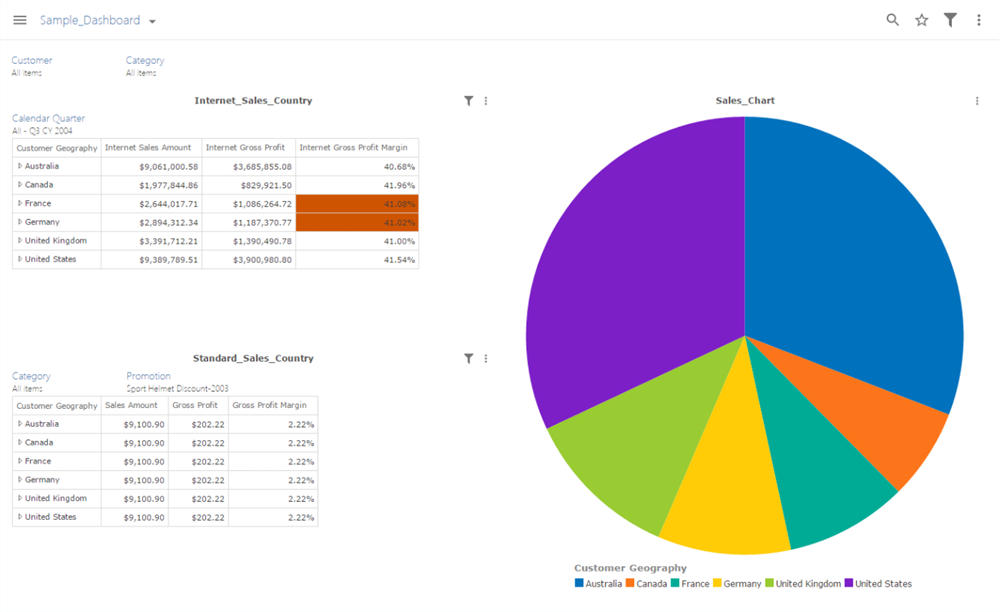
The Consumer view is a read-only view optimized for ease-of-use when viewing resources, such as analyses, charts, and dashboards. It will appear by default for all users. It will also be the view presented on mobile devices.
A sample of this view, with a dashboard resource displayed, is shown here:
 |
Favorites
Note
Resources and folders added to your Favorites folder in the Consumer view will also appear in your Favorites folder in the Designer view, and vice versa. For more information on using this feature in the Designer view, see Using the Resource Explorer Favorites List.
You can add a resource or folder to your Favorites folder by clicking the Favorites icon on the ellipsis menu.
Once a resource or folder is designated a favorite, the icon changes to show its favorite status.
Slicing
The slice experience is identical between the two different views of the data. For Analyses resources, the slicers present at the top. Click the drop-down arrow for a given slicer to interact with it. You may also enter search criteria to filter the list of displayed members, as in the following image.
Depending on the slicer-type configured by the designed multi-select and range-slice options may be available to you.
Drill-through
You can create a drill-through resource by right-clicking an analysis table cell and selecting the Create Drill-through option.
Expanding members and sub-totals
Subtotals can be enabled and viewed for measures in both columns and rows. They are useful when you have created a "virtual" hierarchy in an analysis (by using items to create a pivot table). To view sub-totals, you will need to expand the columns and rows by clicking on the 4.
Paging
If your analysis or drill-through spans more than one screen, a screen icon appears, allowing you to specify which screen you want to view. This icon only appears if it is needed.
When clicked, a list of pages appears. You can select the screen you want to view by either clicking the screen number or entering the number in the text box at the bottom of the list. The currently selected screen has a circle around it.
Refreshing data a determining last updated date
You can click the Refresh icon in the ellipsis menu to confirm you are viewing the most recent version of the resource or folder.
Printing, sharing and, distributing
Printing
You can print the current resource using the Print option in the ellipsis menu. Once this option is clicked, your browser's standard print feature is used to complete the operation. This option is not available for folders.
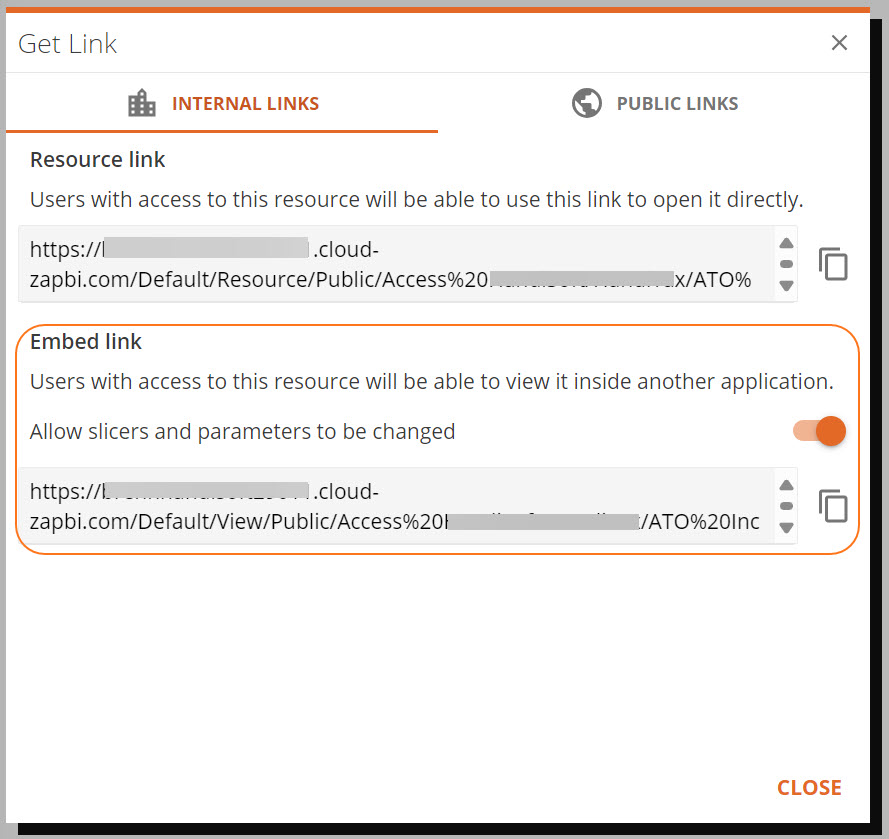
Sharing
Share resources by clicking on "Get Link" in the ellipsis menu,
View embedded reports in teams
Data Hub now offers the convenient ability to embed reports directly into your Teams channels.
For example, an accounts department interacting with a tax dashboard daily can embed it into the Teams accounts or tax channel, allowing users to access their data directly within Teams.
Get the embed link from the resource in Data Hub
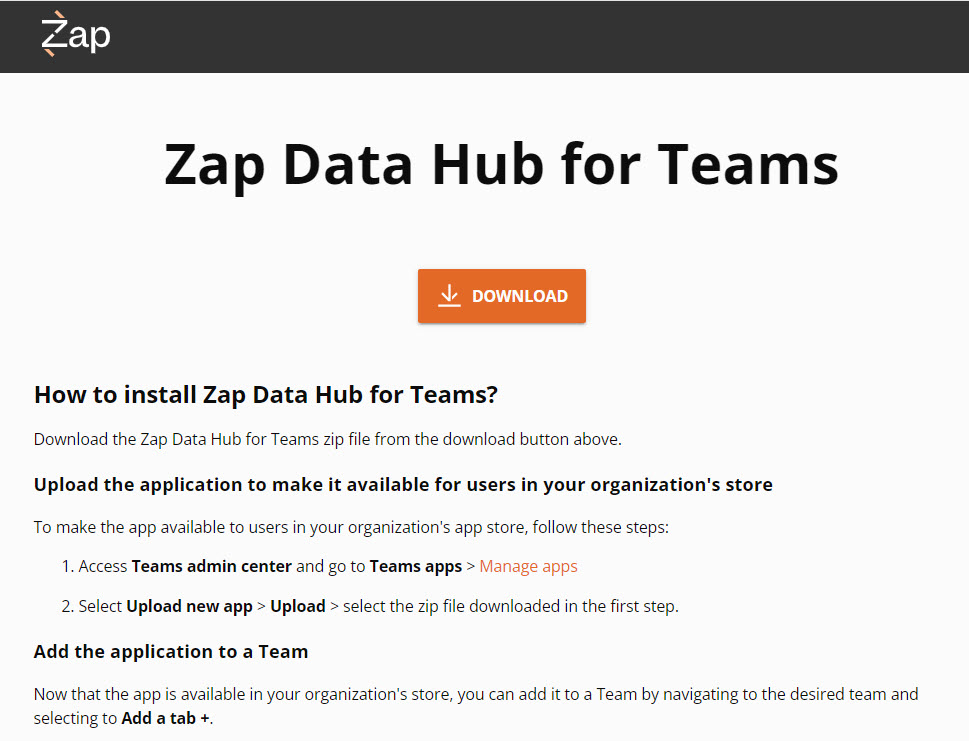
Download Zap Data Hub for Teams and add this as an app in teams, following the instructions from this link.
Add the app to a tab in teams
Note
This feature is currently available only when the Data Hub instance is configured to use Entra ID (formerly Azure Active Directory) for authentication. Support for other authentication methods will be available soon.
Emailing
You can email resources for viewing outside of the Data Hub application. In addition, with some resources, you can specify the file format used to attach the resource to the email.
Downloading
You can download analyses and charts to your local computer as different file types, such as PDFs or Excel files. The file options available vary based on the type of resource you are downloading.