Consume Data Hub Analytics
Consuming Data Hub Analytics allows users to view reports (charts and tables) that designers have built. Consumer users can view existing resources ( with read-only access) and perform resource management tasks (copy, paste, rename, save as and delete) in their personal folder only but cannot create or distribute resources.
Consumer resources
There are three types of resource that can be opened by a consumer user from the Resource Explorer:
Tables.
Charts.
Dashboards.
Opening resources
Open the Resource Explorer.
Locate the resource you want to open and either:
Double click the resource, or,
Right-click the resource and select Open.
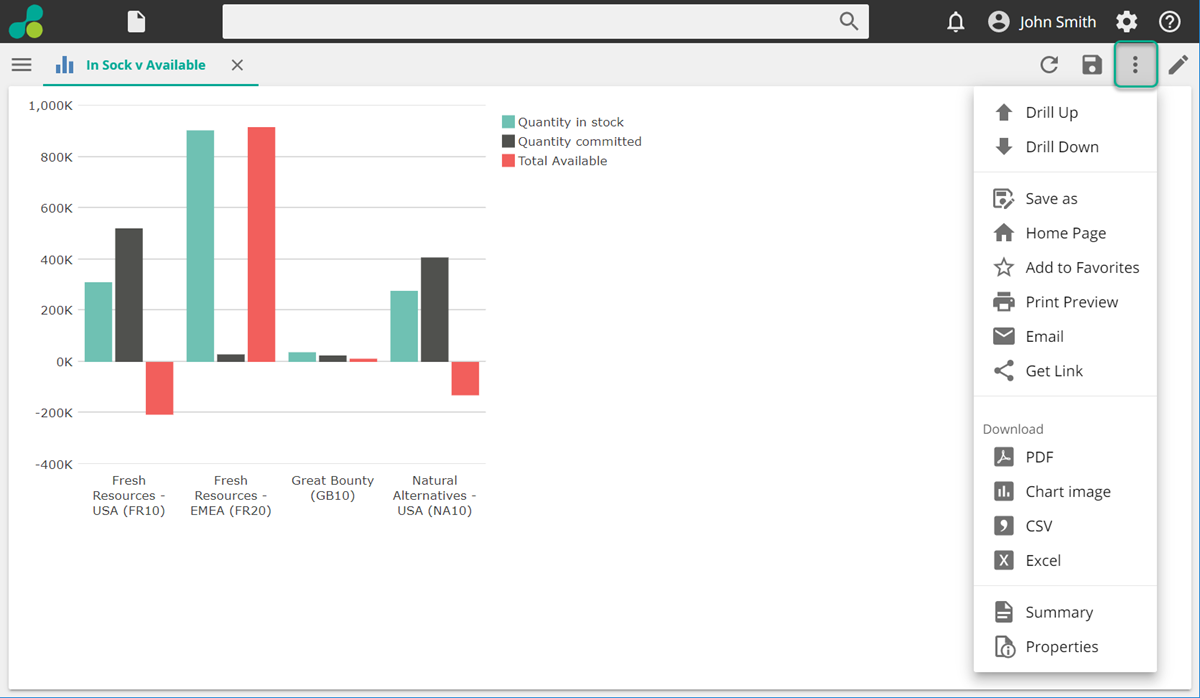
Using the Options menu
The Options menu is accessed by clicking the ellipsis to the right of the Save icon.
 |
Option | Description |
Drill Up | Drills up one level. |
Drill Down | Drills down one level. |
Save As | Allow you to save the report to an alternate location. |
Home Page | Returns you to the home page. |
Add to Favorites/Remove from Favorites | Allows you to add or remove from your favorites. |
Print Preview | Allows you to preview and print reports. |
Allows you to send the selected report as an attachment in an email. | |
Get Link | Allows you to create a link to share the report. |
Download PDF | Downloads a PDF of the selected report. |
Download Chart Image | Downloads only an image of the selected chart. |
Download CSV | Downloads the data in the selected report as a CSV file. |
Download Excel | Downloads the data in the selected report as an Excel spreadsheet. |
Summary | Produces a summary of the selected report. |
Properties | Shows the properties of the selected report. |
Using Filters
About Designer View Filters
Filters from the Designer view are automatically applied to the consumer view resources but are invisible to the user. Only slicers are visible in the Consumer view and can be manipulated.
Determining Slicer Visibility
The Show Slicers Inline button controls where slicers appear in Consumer view.
This button appears on the DESIGN ribbon for dashboards and on the DATA ribbon for all other resources (when slicers are available for the resource).
The behavior of the feature is as follows:
When the button is clicked (appears highlighted), slicers appear directly above the resource (inline) and via the Filter bar.
When the button is not clicked, slicers can only be accessed via the Filter bar.
Additional control of slicers is available when using dashboards. For more information, see Controlling Slicer Visibility in Individual Cells.
Using Parameter Prompts in Slicers
You can use parameter prompts (also known as parametrized functions) when designing a resource.
These supported prompts include:
Number input
Checkboxes
Text boxes
Drop-down lists
Using Slicers
Slices on Dashboards
In Data Hub dashboards, it is easy to slice resources in canvas cells by other resources (for example, a named set or slicer resource). Any of the following methods can be used.
Note
Note: Slicer behavior in a dashboard may differ from the analysis since analysis slicers use the analysis cube's default measure. To ensure that the analysis is sliced in the same way when used in a dashboard, verify that the dashboard slicer is sliced using the analysis's measure groups. For more information, see About Slicers.
Dashboard Slicer
Slice all of the dashboard's cells.
Click in the blank part of any ribbon to un-select all dashboard cells.
Drag a resource into the dashboard's Slicer placeholder.
Within-cell Slicer
Slice only a selected cell.
Click inside any dashboard cell.
Drag a resource into the cell's Slicer placeholder.
Inter-cell Slicer
Use a resource in one cell as a slicer for another cell.
Hover over the title bar of the cell that will be the slicer.
The cell must contain an analysis, chart, or drill-through resource.
In the top right corner of the cell's title bar, click the Slicer button (it looks like a scalpel).
The slicer cell is now displayed with a blue background, and a Slicer icon appears in its center.
Click anywhere inside the cell to be sliced.
Once the slicer is in place, the sliced cell is displayed with a pink tone, and a Slicer Resource icon (it looks like a pie chart) appears in its center.
Note
The cell can be removed from the slicer by clicking it again. When clicked, the Slicer Resource icon (pie chart) disappears, and the pink background color is removed when you move your mouse pointer off the cell.
Repeat the previous step for any additional cells that need to be sliced. In the following example, the Internet Sales Country analysis (on the right) is slicing the Sample Chart (in pink on the left):
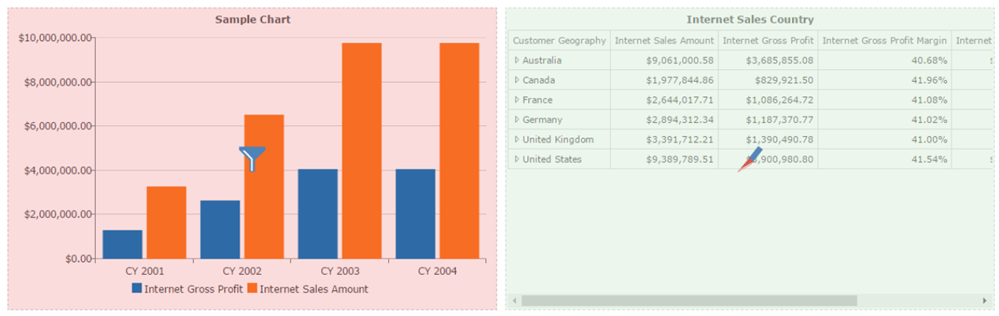
Click anywhere inside the slicer cell (with the slicer icon) to complete the process.
Note
To edit or check the slicing, repeat step 2 above. The slicer cell and cells being sliced again appear colored blue and pink, respectively.
(Optional) Create an inter-cell slicer to use a combination of values (from the row and column headings for the table cell in the slicer cell resource) to filter the cells bring sliced use one of the following methods:
In the cell that is the slicer, click a table cell, row heading, or column heading of analysis or drill-through.
In the cell that is the slicer, click in a bar, line, or other data point in a chart. In the example shown above, clicking in the top-left cell of the 2-D Analysis (containing 1,524.28) will filter the Basic Analysis, so it shows only values for products in the Assorted group which was sold in 2009/2010 Q4.
Slicer Cell
Create a drop-down list of items that can be used to slice other cells.
Drag an element, such as a level, to a blank dashboard cell center.
The cell displays a drop-down list of items that can be used to slice other cells.
Use the steps described in Inter-cell Slicer to configure which cells are sliced by the slicer cell.
Note
You can click within the slicer cell, but not on the drop-down list, to select it. The slicer appears as a tab in the cell's Slicer placeholder. You can add additional slicers by dragging them to the cell's Slicer placeholder and right-click a slicer tab to change its slicer type.