Application logs
View application log
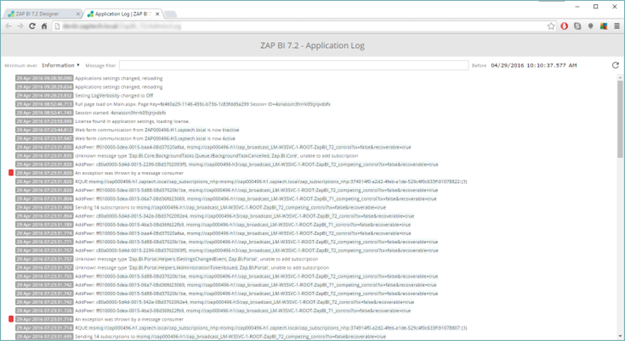
Events recorded in the Data Hub application log are able to be viewed via a separate browser tab accessed from the Settings tab.
The information that is available for display from the log file can be controlled using the Application Log Verbosity setting in the Application Metrics group.
 |
Note
Data Hub supports logging to an SEQ log server, which provides a more comprehensive toolset for working with logs.
The Application log link is available from Settings > Utility Toolbar.
The amount of information available for display is based on the Application Log Verbosity setting. The Minimum level drop-down list can then be used to further filter this available information.
 |
Display options:
Verbose. Displays all information about every event to the table.
Debug. Displays only Debug, Information, Warning, Error, and Critical Error events to the table.
Information. Displays only Information, Warning, Error, and Critical Error events to the table.
Warning. Displays only Warning, Error, and Critical Error events to the table.
Error. Displays only Error and Critical Error events to the table.
Fatal. Displays only Fatal Error events to the table.
Filter options:
Verify that you are viewing the most up-to-date log information by clicking Refresh.
Use the Message filter text box to filter the displayed log information based on the messages written to the log file. The filter is dynamic, and the log information is automatically updated as you type.
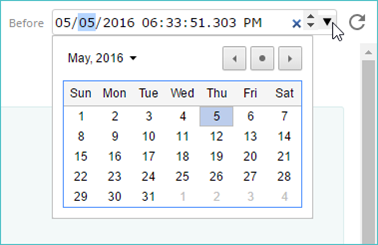
Use the Before text box to filter the displayed log information by the date the information was written to the log file. The filter is dynamic, and the log information is automatically updated as you adjust the filter options. Only log information that was written prior to the specified date/time is displayed.
 |
Important
The number of log-days available is based on the Application Log Retention setting. If only a single day of log information is saved, then going back more than one day will lead to no information being displayed.
Date and time filters:
Type directly in the text box to edit the displayed date and time.
Click the x button to automatically see all log information before the current system date/time.
 |
Highlight a portion of the date/time, and use the spin box control to change the highlighted value.
Click the drop-down arrow to select the date from a standard calendar interface.
Click an entry in the table to display all its details.
 |
 |
You can download the application log from the Diagnostics tab.
Application diagnostics
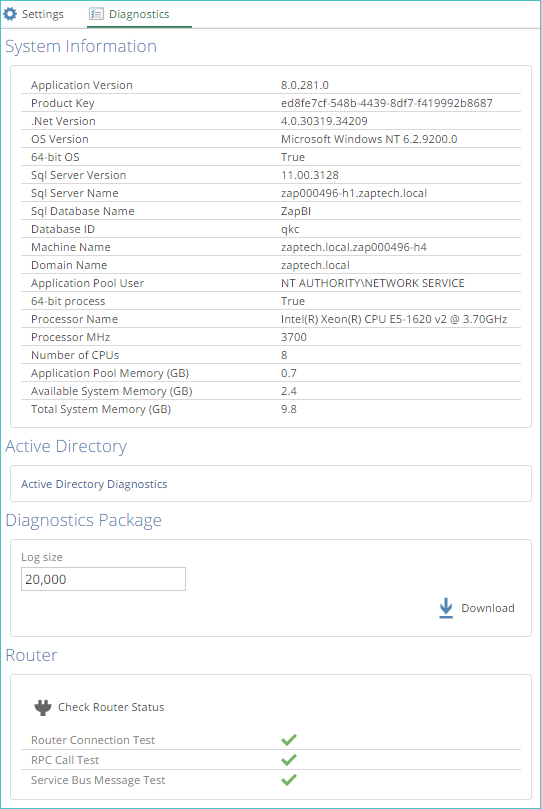
Diagnostic information is available from Settings > Diagnostics.
 |
Logfile download display
Basic system information. System Information area displays details including the version of Data Hub you are using, your version of Microsoft Windows, and other information that may be useful when troubleshooting system or application issues.
Active Directory diagnostic information. In the Active Directory area, click Active Directory Diagnostics link to view a separate web page that allows you to view user or group diagnostics.
Diagnostics package. In the Diagnostics Package area, you can download a zip file containing the Data Hub application log, license information, the license report, and the details shown in System Information area.
The zipped package includes the following files:
Application log (ApplicationLog Excel file) and license information file (License.json) may be useful when processing support requests.
License reports (LicenseReports.json) is a regularly produced diagnostic file that monitors your Data Hub usage and statistics (such as the size of your data warehouse). However, you can disable this behavior using the Send product usage data application setting.
System information file (SystemInformation.json) contains information specific to your installation of Data Hub such as your domain and host name, the operating system you are using, and your SQL database details. It may be useful when processing support requests.
Note
The JSON files can be opened in any text editor.
Specify the maximum size of the downloaded file (in rows) using Log size text box, and click Download.
System information file (SystemInformation.json) contains information specific to your installation of Data Hub such as your domain and host name, the operating system you are using, and your SQL database details. It may be useful when processing support requests.